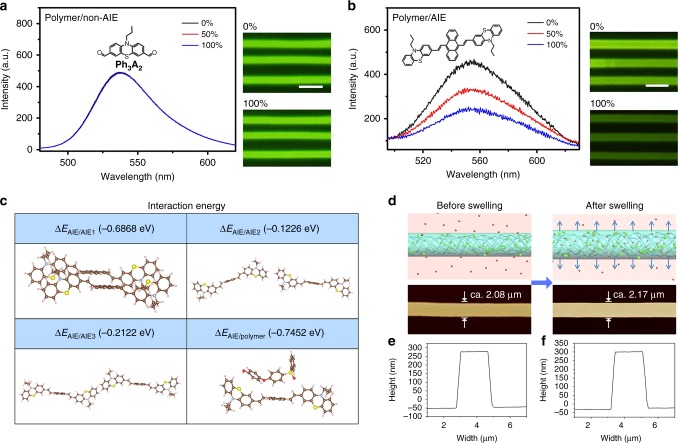
Fig. 2.
Proposed mechanism of polymer/AIE molecule microwires for organic vapor sensing. Fluorescent emission spectra of a PES/non-AIE molecule and b PES/AIE molecule microwires before (0%) and after (50 and 100%) exposure to acetone vapor. Inserted photos are fluorescent images of PES/non-AIE molecule and PES/AIE molecule microwires before (0%) and after (100%) exposure to acetone vapor. All scale bars are 5 μm. 100% is the vapor pressure of acetone under ambient condition, and 50% is half of the vapor pressure of acetone under ambient condition. The used polymer is PES, the non-AIE molecule is Ph3A2, and the AIE molecule is AnPh3. The molecular structures of Ph3A2 and AnPh3 are shown as the insets. Both fluorescent excitation wavelengths are 440 nm. c Optimized geometry structures and interaction energies of AIE dimers and AIE/polymer for DFT models, proving the stronger interaction of AIE/polymer than that of AIE dimers. d The proposed mechanism of fluorescent intensity variation after exposure of polymer/AIE molecule microwires to organic vapor. The absorption of acetone vapor causes swelling of the PES/AnPh3 microwires, and increases the intermolecular distance of AnPh3 molecules due to the stronger interaction between AnPh3 and PES, leading to the dispersion of AnPh3 molecules and decreased fluorescent intensity. The used polymer is PES, and AIE molecule is AnPh3. The figures below represent AFM topographies of PES/AnPh3 microwires before (left) and after (right) exposure to saturated acetone vapor, indicating polymeric swelling increases the width of microwires (by 3.85 ± 0.34%, error bars, s.d. n = 20) after exposing the sensor in saturated acetone vapor. e, f Height diagram of PES/AnPh3 microwires, indicating polymeric swelling increases the height of microwires (by 3.31 ± 0.23%, error bars, s.d. n = 20) after exposing the sensor in saturated acetone vapor

