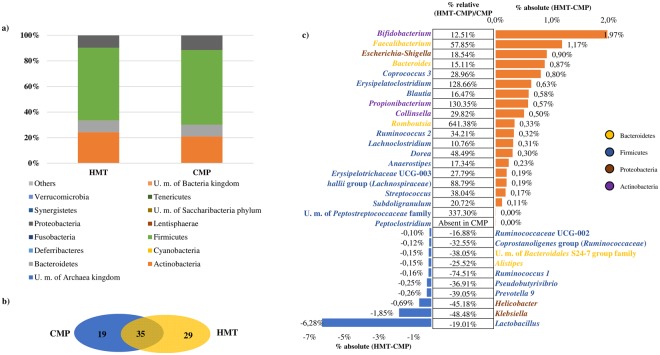
Figure 1.
Exploration of the diversity in HMT and CMP groups. Panel a represents a bar plot of the bacterial phyla identified in the 24 analyzed samples. Panel b depicts a Venn diagram illustrating the total, unique and shared number of OTUs predicted for HMT and CMP datasets. Panel c shows the variation in terms of relative abundance of >0.4%, and showing either an increase of >10% or decrease of <−16% in CMP data sets as compared to those obtained from HMT samples.

