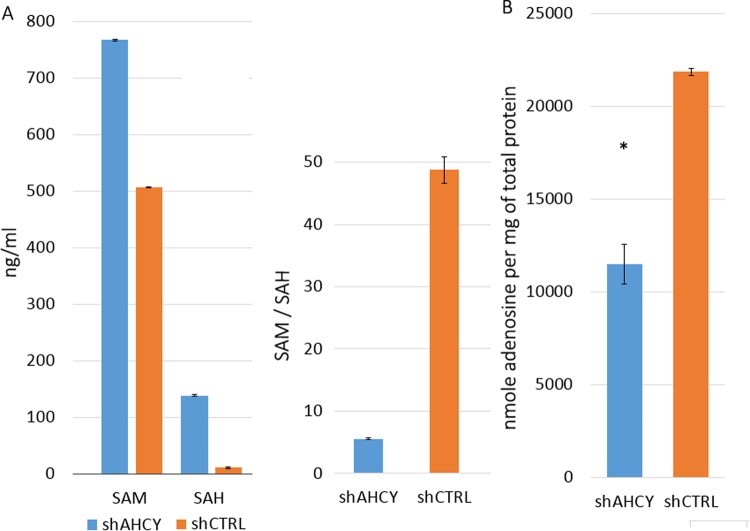
Figure 1.
SAM/SAH and adenosine measurements. (A) Levels of SAM and SAH (ng/ml) and their ratio (SAM/SAH) in the lysates of AHCY-silenced and control cells, as measured by LC-MS/MS. ± SD is represented as vertical line and is based on three independent measurements. (B) Adenosine was determined in the deproteinised cell lysates of AHCY-knockdown and control cells using an Adenosine Assay kit (BioVision) and represented as nmole adenosine per mg of total protein in the cell lysate. Vertical lines represent ± SD of two 2 individual measurements performed in triplicates for each sample (*means P < 0.05; determined by two tailed t-test).

