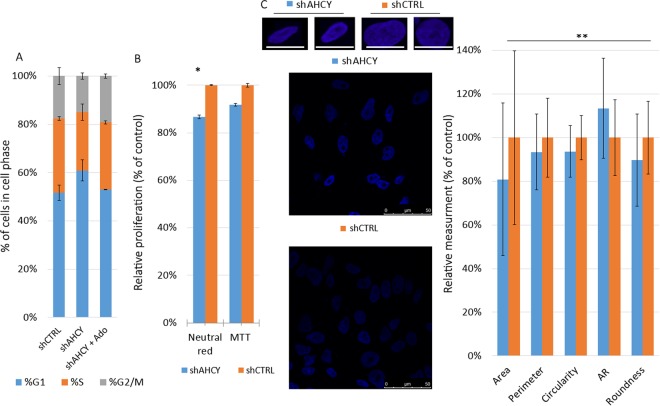
Figure 2.
Morphometric and cell cycle analysis. (A) Effects of AHCY silencing on the cell cycle distribution determined by flow cytometry after staining with propidium iodide. G1, S and G2/M indicate the cell phase in question. The graphs show the mean ± SD of three independent experiments performed in triplicate for each tested sample. (B) Changes in the cell proliferation rates of AHCY-silenced cells compared to control cells, as determined by NRA and MTT tests. The graphs show the mean ± SD of three independent experiments performed in at least 10 wells/cell line (* means P < 0.0.05; determined by two tailed t-test). (C) Upper panel: representative nuclei images (blue: DAPI). Centered is a field of view containing >10 cells for each condition. Graph: changes in the main nuclear morphometric features in % when compared with shCTRL set as 100% (mean of more than 100 nuclei; ** means p < 0.01 determined by two tailed t-test). Imaged with a Leica SP8 X FLIM confocal microscope (HC PL APO CS2 63 ×/1.40 OIL objective); scale bar, 50 µm.

