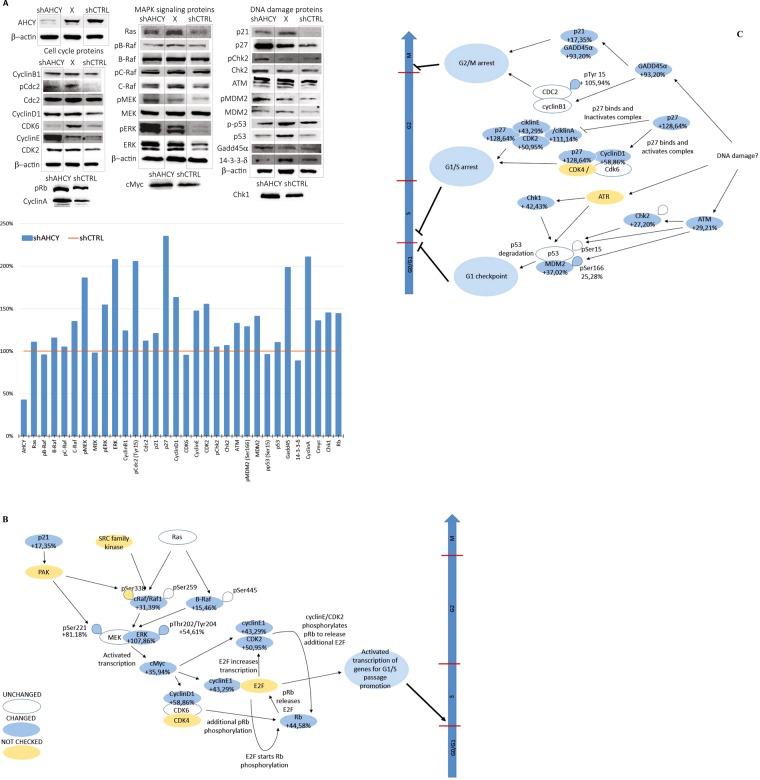
Figure 3.
Proposed effects of AHCY silencing on cell cycle regulating proteins and checkpoints based on Western blotting results. (A) Upper panel: Protein expression levels (names listed in Table 2) analysed by Western blotting (30–80 μg of whole cell proteins loaded per well). Bands in lane marked with “X” were not analysed. Lower panel: Signal densitometry was performed using ImageJ software. Each band was normalized using β-actin as the loading control. The shAHCY signal for each protein was expressed as the % change versus shCRTL, which was set to 100% (orange line). (B and C) Schematic diagrams of the Western blot results, for which changes in the signal for each analysed protein in AHCY-silenced cell lysates are represented as the % change versus control cells (set as 100%). Signal densitometry was performed in ImageJ software, and each band was normalized using β-actin as the loading control. Maximum change between β-actin signals for the same sample on 10 membranes exposed at the same time is +/− 11.2% and was used to verify the degree of reproducibility of the method as well as to designate all the proteins with expression changes lower than +/− 11.2% as unchanged. “p” signifies the phosphorylated form of the protein. Arrows indicate the positive impact on the downstream molecule (activation), while bars represent the negative impact on the downstream molecule (repression). The large arrow indicates the cell cycle where the cell phases are marked with G1, S, G2 and M, while horizontal bars represent cell cycle checkpoints marked red if impacted by the proposed pathways.

