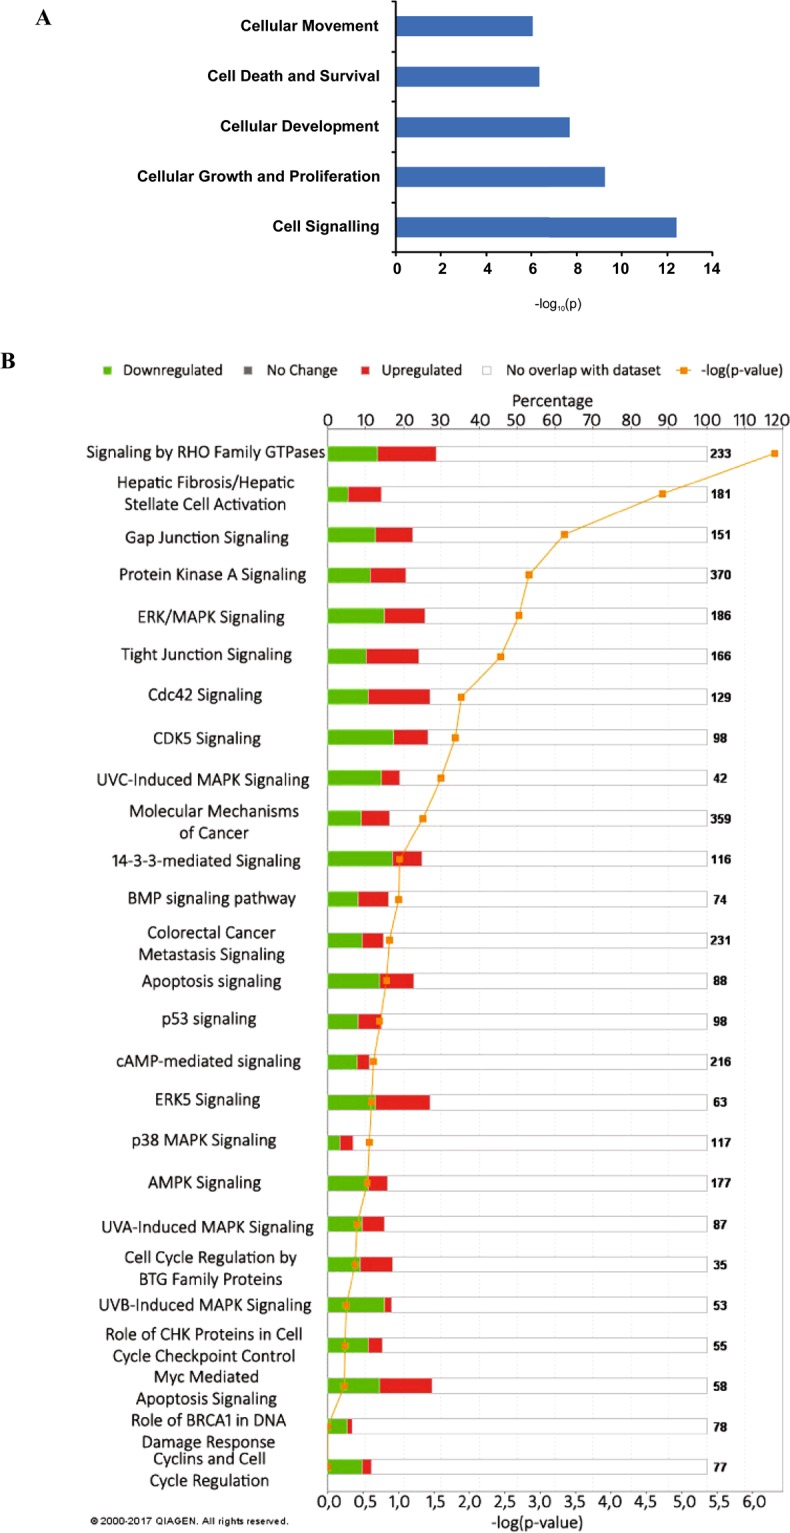
Figure 5.

Functional analysis of the omics data performed by IPA software. For both the SILAC and RNA-Seq data, candidates that were imported into the IPA software occurred in all replicates and showed significant up- or down-regulation in AHCY silenced cells compared to the controls. (A) The upper section is a rough overview to display common changes in the datasets and the most prominent molecular and cellular functions based on the significance range (p-value). (B) The lower section is a graphical representation of the functional categories selected based on the categories that are of the highest relevance to cancer signalling, control of the cell cycle and DNA damage. The p-value is calculated using the right-tailed Fisher’s exact test and was set to less than 0.05 for the upper panel to indicate a statistically significant, non-random association but lowered to 0.00 for graphical representation to evaluate pathways probably associated with the data based on the portion/percentage of the up- and down-regulated or not present molecules involved in the pathway and represented on the bar in red, green or white colour. For each bar, the number of identified up- or down-regulated molecules is shown.
