Fig. 2.
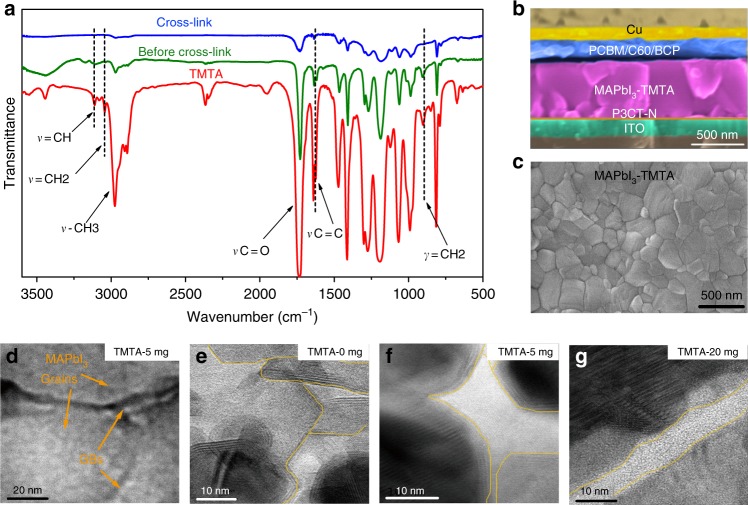
FTIR and morphology characterization. a FTIR spectra of MAPbI3–TMTA films before (olive), after (blue) cross-linking and pure TMTA (red). The dash lines indicate the characteristic vibration peaks of TMTA. b Devices structure and cross-section SEM images of inverted PSCs used in our work. c Top-view SEM images of MAPbI3–TMTA films. d Low-magnification TEM image of MAPbI3–TMTA films. TMTA-5 mg indicates that the concentration of TMTA in MAPbI3 precursor solution is 5 mg mL−1. e–g High resolution TEM of perovskite films: (e) MAPbI3; (f) MAPbI3–TMTA (5 mg mL−1), and (g) MAPbI3–TMTA (20 mg mL−1). The yellow lines demarcate the grain boundary (GB) regions

