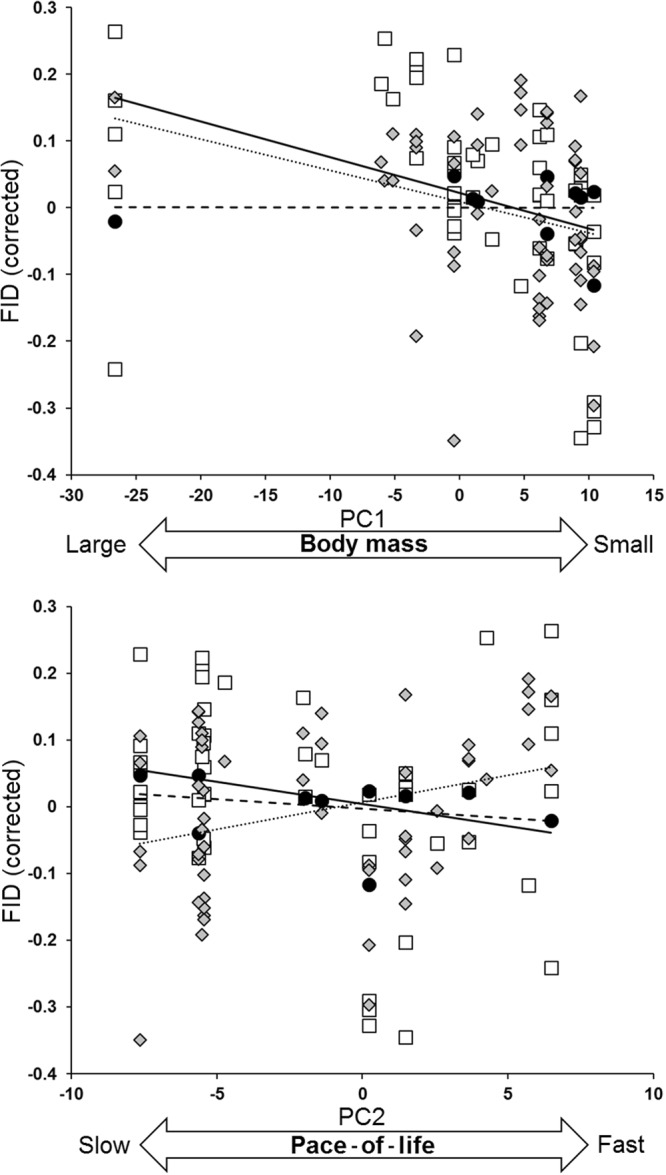
Figure 1.

Changing relationships between flight initiation distance (FID) and body mass (PC1) and slow–fast pace of life (PC2) gradients between stages of the annual cycle (breeding = open squares, continuous line; migration = filled dots, dashed line; winter = grey diamonds, dotted line). Lines are linear regression lines computed by means of phylogenetically corrected regressions accounting for phylogeny, sample size, starting distance and flock size effects. B (±SE) and P values are: PC1, breeding: −0.009 (±0.002), P < 0.001; PC1, migration: −0.001 (±0.002), P = 0.498; PC1, winter: −0.006 (±0.003), P = 0.056; PC2, breeding: −0.011 (±0.004), P = 0.008; PC2, migration: −0.008 (±0.005), P = 0.150; PC2, winter: 0.007 (±0.004), P = 0.097.
