Fig. 5.
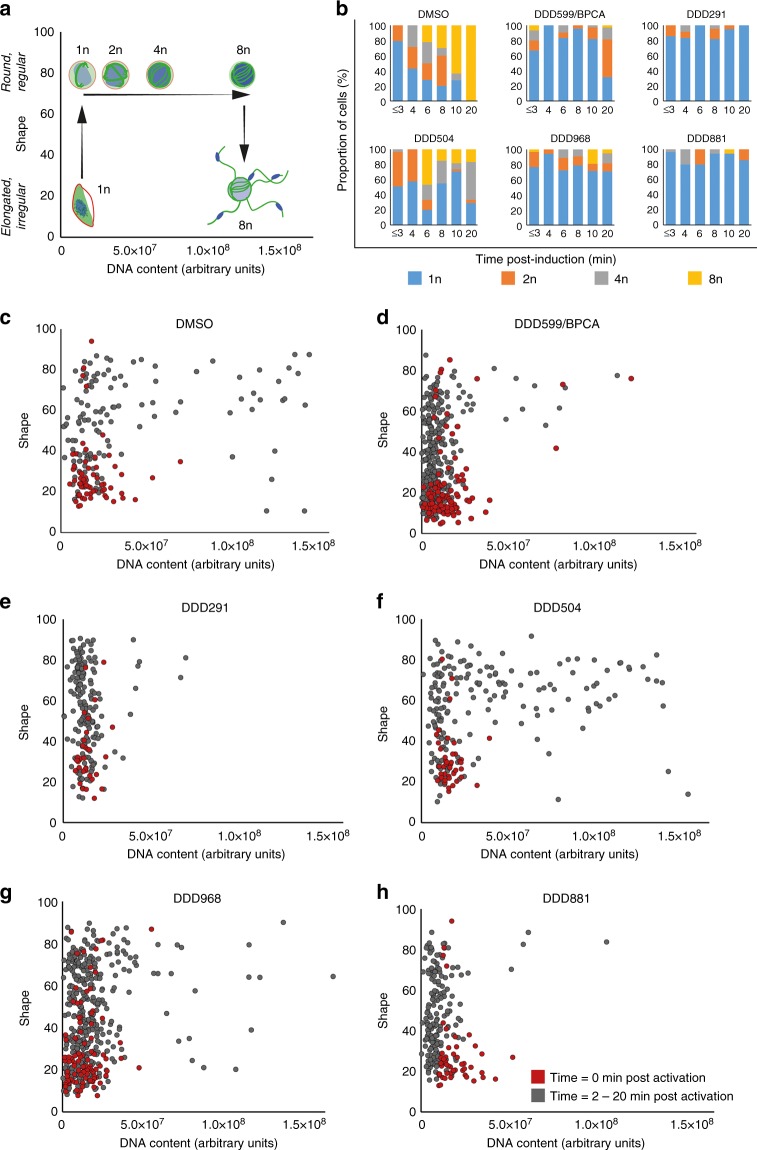
Computer-aided quantification of male gamete formation from IFA images. Individual cells were extracted from IFA images stained for α-tubulin, glycophorin A and DNA from samples fixed between 0 and 20 min post induction of gamete formation (n = 195–668 cells per compound treatment). Cell shape (elongated/irregular vs. round) and haploid chromosome number (1nto 8n) were estimated from α-tubulin and DAPI staining (DNA content) respectively (arbitrary units). a Schematic diagram illustrating how cell shape and DNA content parameters vary over the course of male gamete formation. Initially gametocytes are elongated with 1n haploid chromosome number. Upon induction, they round up then undergo three rounds of DNA replication whilst maintaining a round shape. Finally, male gamete release (exflagellation) changes the shape of the cell whilst maintaining a high DNA content. b Genome copy number during gamete formation was estimated by benchmarking mean DAPI intensity with respect to the non-activated gametocytes at t = 0 min (1n) and exflagellating cells at t = 10–20 min (8n). DNA replication was compared between the DMSO control and five test compounds. c–h Graphs plotting the cell shape and DAPI intensity data for each individual cell analysed. Red dots show the initial distribution of cells before induction (t = 0 min). Grey dots show induced cells (t = 2–20 min)

