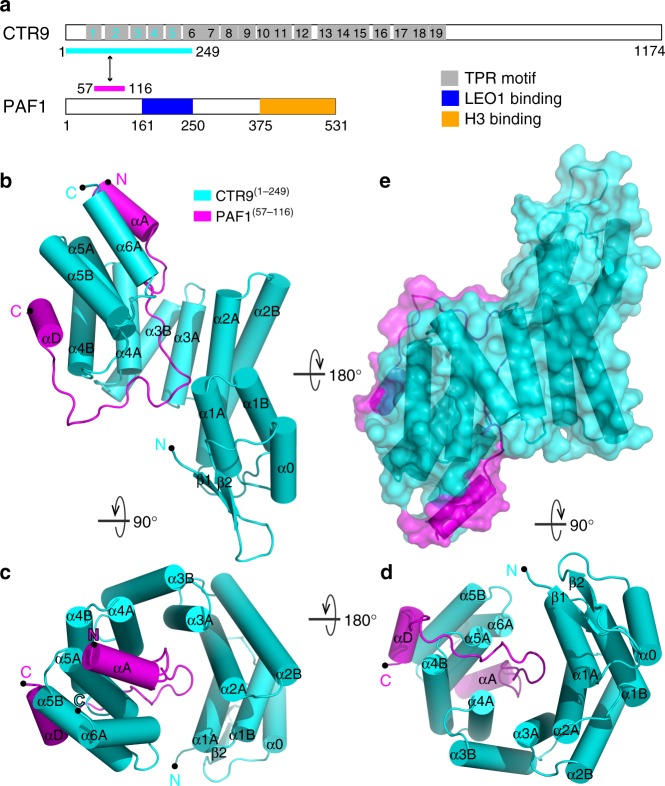
Fig. 1.
Crystal structure of the human CTR9/PAF1 heterodimer. a Schematic representation of full-length CTR9 and PAF1. A LEO1-interacting region (blue) and a histone H3-interacting region (orange) are shown in PAF1. The predicted 19 TPR motifs (gray) were defined using TPRpred (https://toolkit.tuebingen.mpg.de/#/tools/tprpred). The protein fragments of the CTR9(1–249)/PAF1(57–116) complex used for structural determination are indicated by a two-way arrow and are colored cyan and magenta, respectively. b Ribbon diagram representation of the CTR9(1–249) (cyan)/PAF1(57–116) (magenta) complex viewed from the side. The N- and C-termini of the two proteins are labeled. Cylinder representation of the CTR9(1–249)/PAF1(57–116) complex structure viewed from the top (c) or the bottom (d). e Surface representation of the CTR9(1–249)/PAF1(57–116) complex with its orientation corresponding to the other side from that shown in (b)

