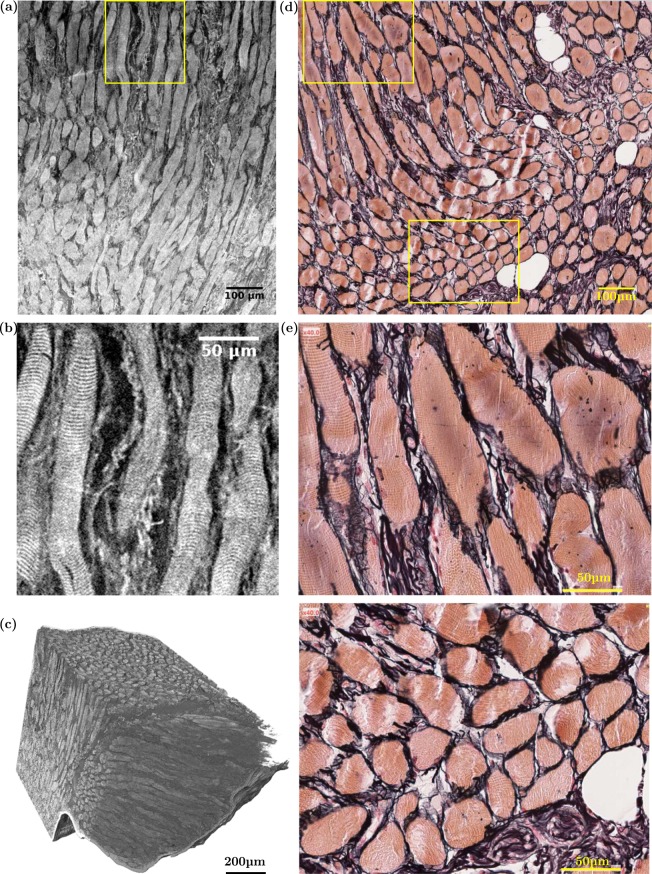
Figure 3.
Comparison between (left) synchrotron high-resolution X-ray microtomographic images (PRI mode, Vvox = 0.653 μm3) of the left vocalis fibrous network and (right) 2D histological photomicrographs of the right vocalis excised from the same larynx L10. (a) 2D coronal view of L10-S3, [C2H60] = 70%. (b) Zoom on the banding patterns of the muscle fibres located within the yellow frame in (a). (c) 3D reconstruction of L4-S2, [C2H60] = 30%. (d) 2D coronal view of L10-S5, prepared with Reticulin stain: Type III collagen fibres (black); muscular striated-cells or “fibres” (orange); adipocytes (white). (e) Zooms on the banding patterns of the muscle fibres located within the yellow frames in (d).

