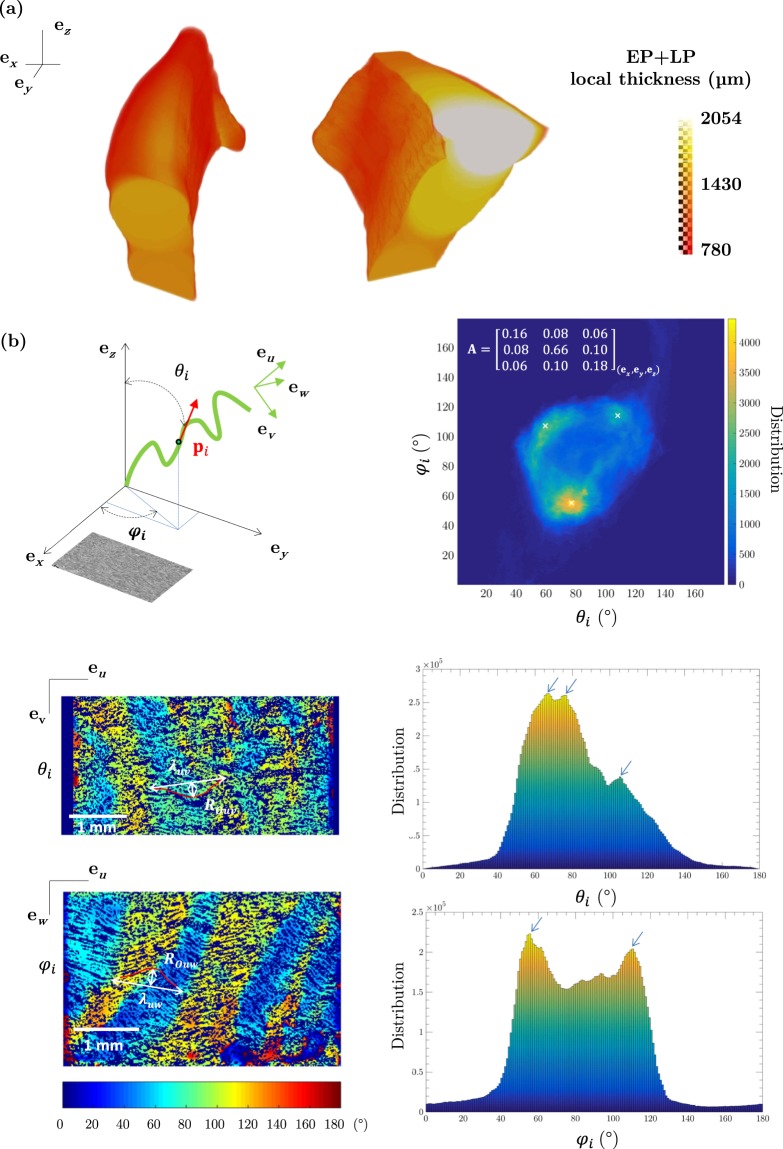
Figure 5.
Quantification of several structural descriptors of the vocal-fold EP-, LP- and M-sublayers derived from images acquired at medium spatial resolution (voxel size of 133 μm3) (L9). (a) 3D local thickness map of a EP+LP-layer subvolume. (b) 3D orientation map of the muscle fibres network in a M-layer 41.52 mm3 subvolume; corresponding 2D distribution of θi and φi values; illustration of their distribution on two orthogonal 2D slices of the subvolume.

