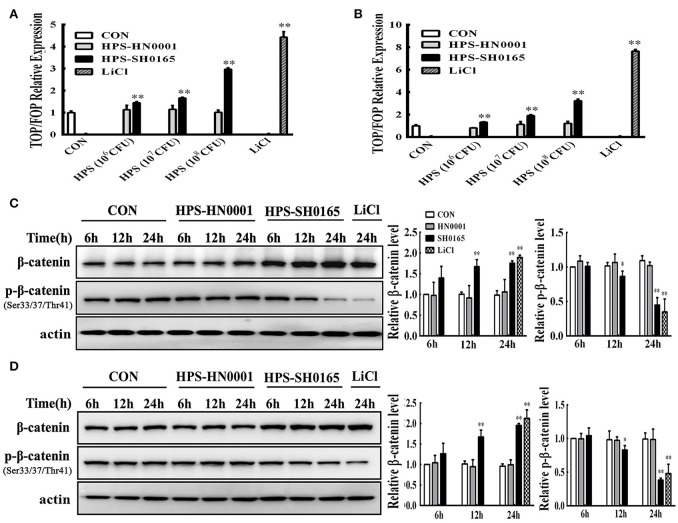
Figure 2.
The high-virulence H. parasuis infection activated the Wnt/β-catenin signaling pathway in PK-15 and NPTr cells. (A,B) PK-15 cells (A) and NPTr cells (B) transfected with TOPflash or FOPflash were stimulated or unstimulated with H. parasuis strains (106, 107, or 108 CFU/mL) or LiCl (20 mM) for 24 h. Cells were lysed and TCF transcriptional activity was determined by TOPflash/FOPflash ratio after normalization with Renilla. Representative results of three independent experiments are shown as the mean +/− SD (n = 3). **p < 0.01 compared with uninfected group. (C,D) For Western blot analysis, lysates were collected from PK-15 cells (C) or NPTr cells (D) stimulated or unstimulated with H. parasuis (108 CFU/mL) or LiCl (20 mM) for indicated periods of time and were subsequently analyzed for the expression of β-catenin and p-β-catenin (Ser33/37/Thr41). β-actin served as a loading control. Relative β-catenin levels and p-β-catenin levels were calculated using Image J software and normalized to β-actin. Values are presented as the ratio of each sample to the 6 h uninfected control (set to 1.0). Representative results of three independent experiments are shown as the mean +/− SD (n = 3). *p < 0.05 and **p < 0.01 vs. uninfected control.

