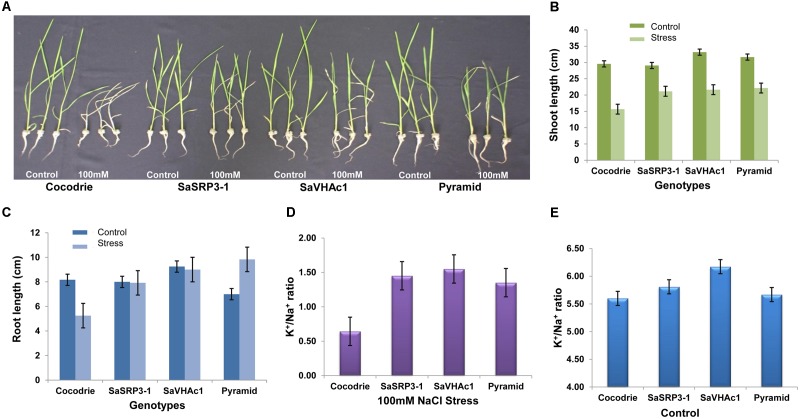
FIGURE 5.
Salt tolerance evaluation of transgenic and wild type plants. (A) Responses of transgenic and wild type rice plants to 100 mM NaCl stress during seedling stage; (B) Comparison of shoot length; (C) Comparison of root length; (D) K+/Na+ ratio in shoot 12 days after exposure to 100 mM salt stress; (E) K+/Na+ ratio in shoot under control condition; Values represent means ± SD of five independent replicates. Error bars represent standard error.

