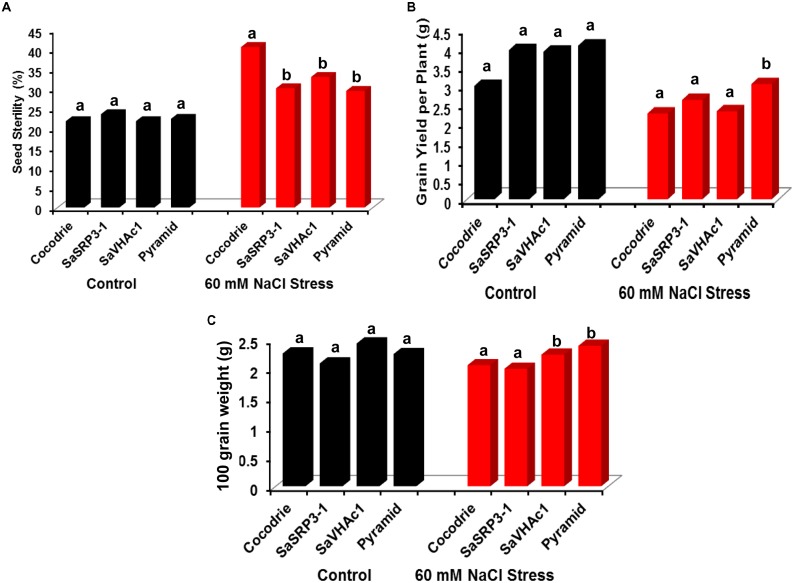
FIGURE 7.
Analysis of yield parameters in transgenic and control plants under salt stress at the reproductive stage in greenhouse. (A) Impact of salt stress on grain filling and seed sterility; (B) comparison of grain yield per plant under salt stress; (C) variation in 100-grain weight due to salt stress. Different letters on bar diagram indicate the statistical significance at 5% level based on Dunnett’s test.

