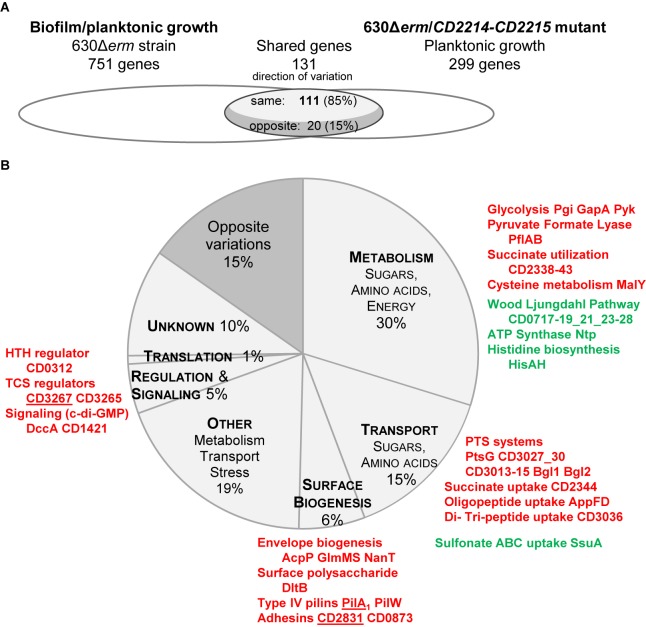
FIGURE 6.
Comparison between CD2214–CD2215 regulon and the set of genes differentially expressed in biofilm/planktonic growth. (A) Overlap. Transcriptomes are drawn as elipses: the set of genes differentially expressed during biofilm/planktonic growth (Supplementary Table S2) is on the left and the set of genes differentially expressed in strain 630Δerm/CD2214–CD2215 mutant (Supplementary Table S4) is on the right. The number of shared genes (whose expression varies in both transcriptomes) is indicated above the overlap region. As shared genes can vary in the same direction in the two transcriptomes or in opposite directions, the overlap region is divided into two parts. The number of shared genes whose expression varies in opposite directions is indicated in the dark gray part, while the number of genes whose expression varies in the same direction is in the light gray part. (B) Functions. Genes common to the two transcriptomes are shown as a pie chart. The main functional categories of genes regulated in the same direction in the two transcriptomes appear in capital letters in light gray slices. A unique dark gray slice is shown for all genes regulated in opposite directions in the two transcriptomes, whatever the functional category they belong to. The function and the product of main shared genes (designated by their name or short identification number) are indicated beside the pie chart. Protein names/short identification numbers are in green or red depending on whether their genes are, respectively, down- or up-regulated in both transcriptomes. Proteins whose genes are controlled by a c-di-GMP riboswitch (Soutourina et al., 2013) are underlined.

