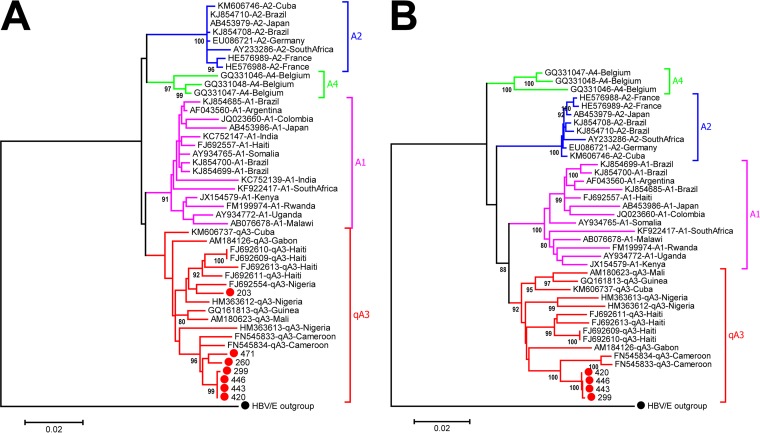
FIG 3.
High-resolution phylogeny of HBV/A sequences. Maximum-likelihood phylogenetic trees of HBV/A pre-S/S (A) and whole-genome (B) sequences from Mbandji 2 (red dots) together with publicly available sequences covering the described HBV/A subgenotypes were constructed in MEGA 6.0. (A) All of the seven HBV/A pre-S/S sequences of this study clustered with strains of quasi-subgenotype A3 (qA3). Distances were calculated using the Kimura 2-parameter model +G. There were a total of 1,206 positions in the final data set. (B) Classification of the Mbandji 2 HBV/A sequences into qA3 was reconfirmed by whole-genome analysis. Distances were calculated using the Kimura 2-parameter model +G +I. There were a total of 3,221 positions in the final data set. Both trees were drawn to scale, with branch lengths measured as the number of substitutions per site, and were rooted using the sequence of an HBV/E strain as an outgroup (black dot). Bootstrap values (≥80%) are shown at branch nodes.

