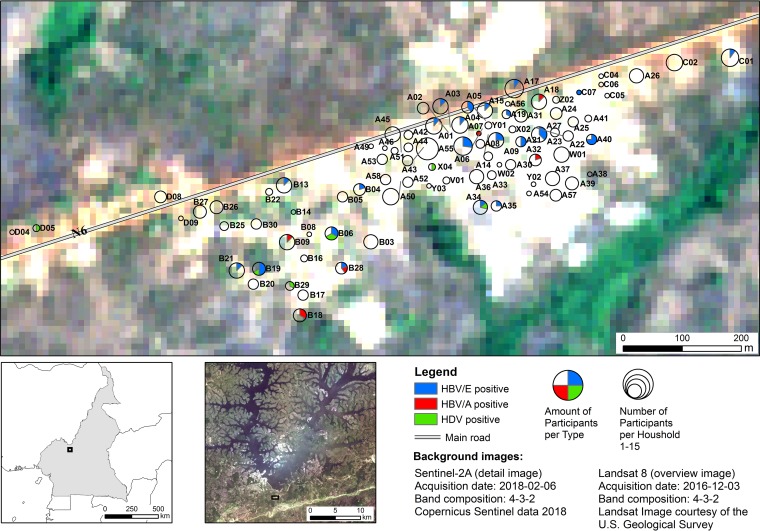
FIG 5.
Geographical distribution of HBV/A, HBV/E, and HDV infections in Mbandji 2. Locations of the 88 households participating in the study are displayed in the form of pie charts, with the pies corresponding in size to the numbers of study participants. Individuals identified as being infected with HBV/A (red) and HBV/E (blue) or coinfected with HBV/E and HDV (green) are represented as slices in the pie charts according to their numerical proportion. No household location is shown for study participant 490, coinfected with HBV/E and HDV, because no demographic information was available. Overview images of Cameroon (lower left) and the Mapé Basin (lower middle) are shown to illustrate the geographical location of the study area (black rectangle). The background images, courtesy of ESA Sentinel and the U.S. Geological Survey, are in the public domain.

