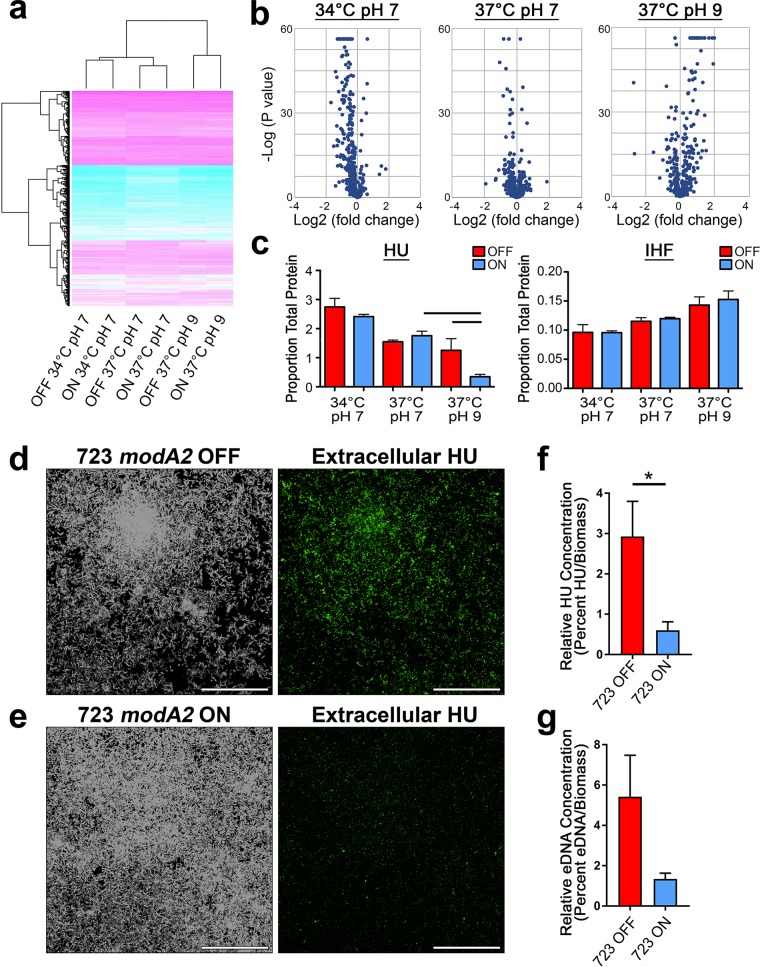
FIG 5.
Relative protein abundance within NTHI strain 723 biofilms. (a) Clustered heat map of protein abundance within biofilms formed by NTHI strain 723 at 34°C at pH 7, 37°C at pH 7, or 37°C at pH 9. (b) Volcano plots of protein abundance between modA2 locked ON biofilms versus modA2 locked OFF biofilms. (c) Relative protein abundance of the DNABII proteins HU and IHF as percentage of proportion of total protein. Lines over the graph indicate adjusted P value of <1.00E−12. (d to e) Laser-scanning confocal images of (d) modA2 locked OFF biofilms and (e) modA2 locked ON biofilms imaged for total biomass (left [white]) and extracellular HU (right [green]). Scale bars, 30 μm. (f) Relative HU abundance within the biofilms normalized to total biomass. *, P < 0.05, unpaired t test. (g) Relative eDNA abundance within the biofilms normalized to total biomass.

