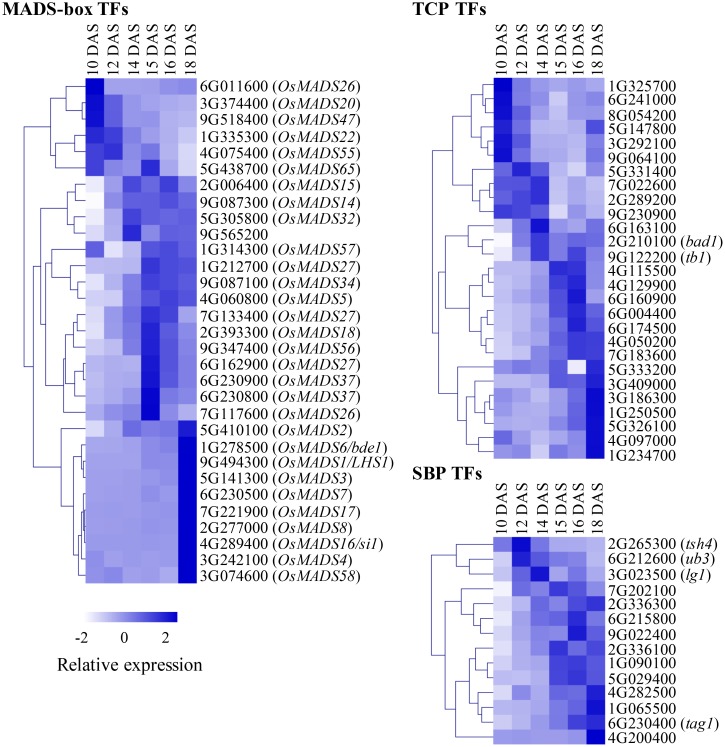
FIGURE 2.
Transcription factor (TF) family members show dynamic expression profiles across inflorescence development. Individual members of MADS-box, TCP and SBP TF families were annotated, TPM values for each were normalized based on a Z-scale and plotted as a heatmap across the six stages of Setaria viridis inflorescence development. For MADS-box genes, names of orthologous genes from rice are included. For TCP and SBP families, orthologs of classical maize genes are indicated. White-to-dark shading represents low-to-high relative expression level.

