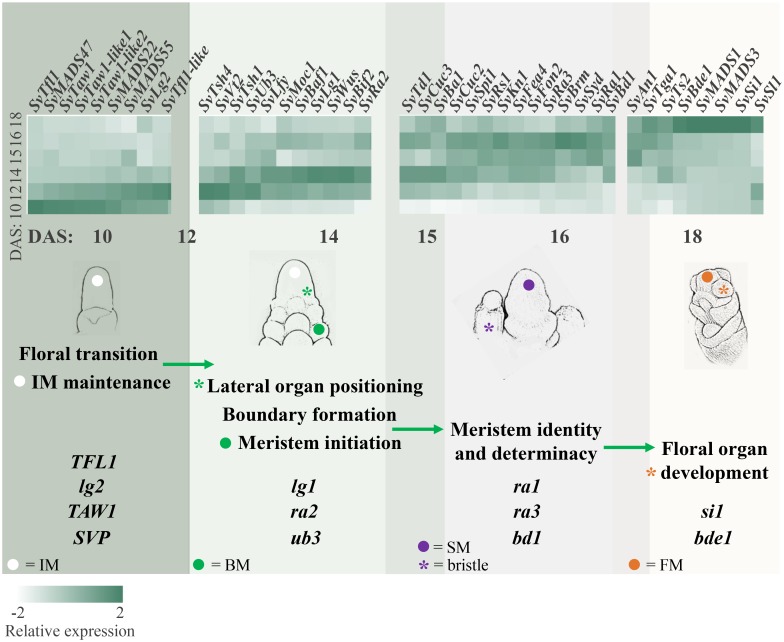
FIGURE 4.
Orthologs of genes known to regulate inflorescence architecture in maize and rice showed expected expression patterns during Setaria viridis inflorescence development and transitions between meristem types. The schematic diagrams sequential developmental transitions captured by the RNA-seq data and shows relative expression of genes predicted to control these transitions. For example, consistent with the initiation of BMs from the IM between 10 and 14 DAS, positive regulators of lateral meristem formation (e.g., SvBif2 and SvUb3) showed increased expression between 10 and 14 DAS, and negative regulators of axillary meristem formation (e.g., SvTd1 and SvFea4) increased later at 14–16 DAS. Genes displayed in the heatmap are divided by group and developmental processes can transition across groups. Light-to-dark color indicates low-to-high relative expression.

