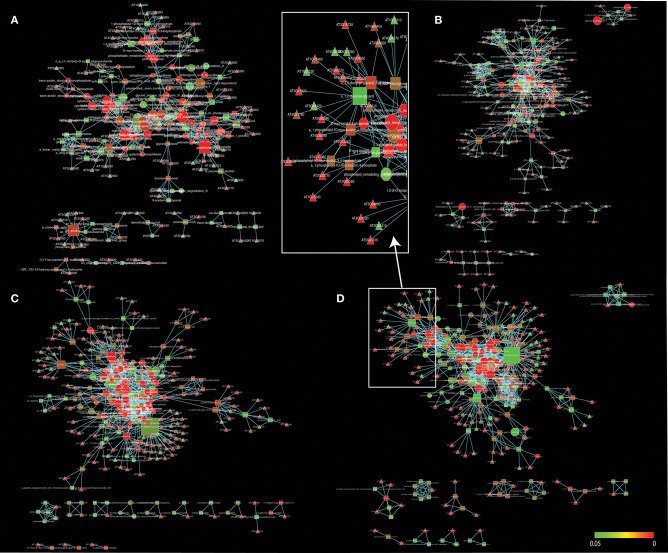
Figure 2.
A gene-metabolite-pathway tripartite network of significant changes (P ≤ 0.05) for 3 h (A), 6 h (B), 12 h (C), and 24 h (D) cold acclimated Arabidopsis. Triangles represent genes, rectangles represent metabolites and octagons represent pathways. Red color range shows most significant genes, metabolites and pathways. Node sizes were scaled to number of neighbors. The networks were visualized by Force directed layout. The white squares represent snapshot of the network. Cytoscape files for network visualization are deposited in https://github.com/gcalab/files.

