Figure 3.

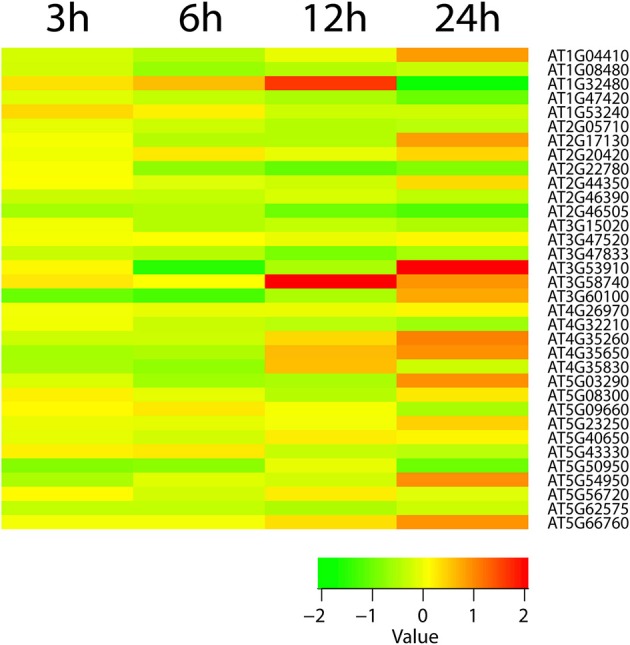
The heatmap diagram of expression profile of TCA cycle genes. Red color hues indicates gene up-regulation while green color hues indicates down-regulation. The green-to-red scale below the heatmap describes expression values.

The heatmap diagram of expression profile of TCA cycle genes. Red color hues indicates gene up-regulation while green color hues indicates down-regulation. The green-to-red scale below the heatmap describes expression values.