Figure 7.
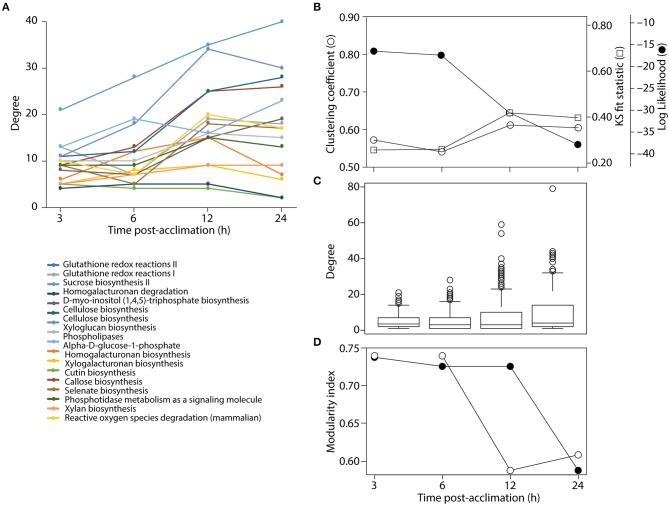
Analysis of network structure. (A) Connectivity of common nodes for all time points. (B) Analysis of network modularity using the clustering algorithm and some statistical descriptor of power law behavior of tripartite networks over time. (C) Boxplots show the span of connectivity measured by node degree for each time point. (D) Analysis of modularity with the FGC (closed circles) and NG (open circles) algorithms.

