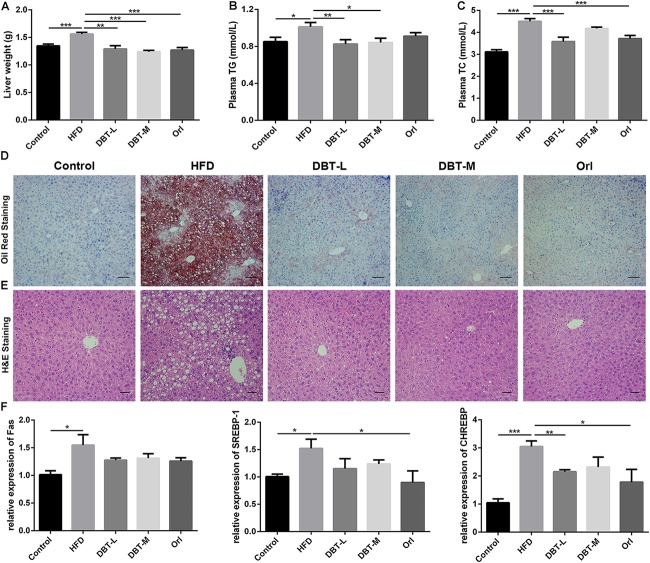
FIGURE 2.
DBT decreases liver lipid accumulation. (A) Liver weight; (B) Serum TG; (C) Serum TC; (D) Oil Red staining of liver, scale bar: 50 μm; (E) Haematoxylin and eosin staining of liver, scale bar: 20 μm; (F) qPCR assays of the liver mRNA levels of Fas, SREBP-1, CHREBP. Results are presented as mean ± SEM (n = 7). ∗p< 0.05, ∗∗p< 0.01, ∗∗∗p< 0.001 compare with HFD group.

