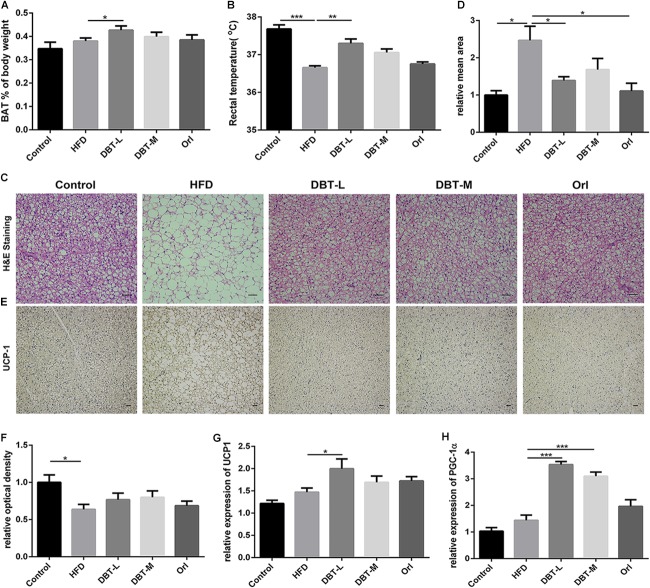
FIGURE 3.
DBT promotes BAT thermogenesis. (A) Ratio of BAT to body weight; (B) Rectal temperature measured at 0900 h; Haematoxylin and eosin staining of BAT (C) and relative mean area (D), scale bar: 20 μm; UCP1 immunohistochemistry of BAT (E) and relative optical density (F); qPCR analysis of the mRNA levels of UCP1 (G) and PGC-1α (H). Results are presented as mean ± SEM (n = 7). ∗p< 0.05, ∗∗p< 0.01, ∗∗∗p< 0.001 compare with HFD group.

