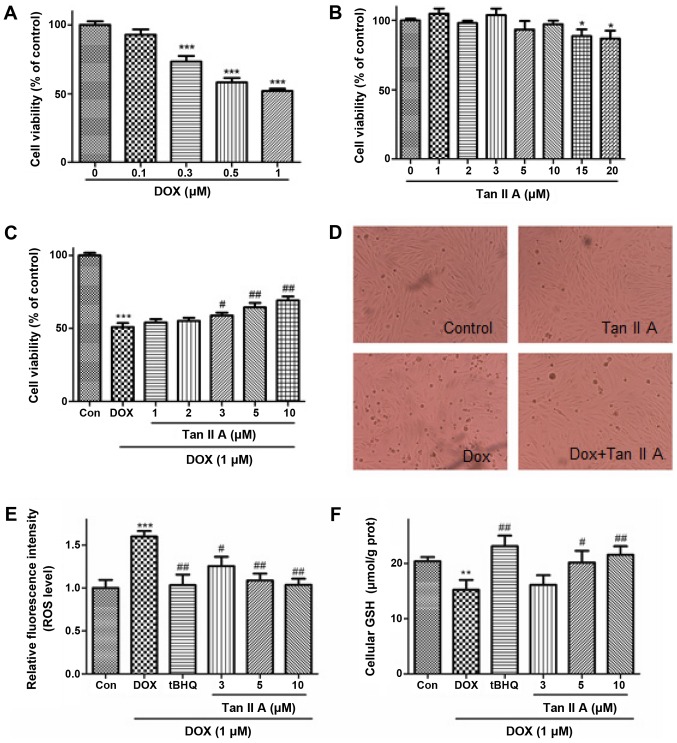
Figure 4.
Effect of Tan IIA on DOX-induced cell injury and oxidative stress in H9c2 cells. Cells were incubated with increasing concentrations of (A) DOX (0–1 µM) for 24 h or (B) Tan IIA (0–20 µM) for 4 h, and cell viability was measured by MTT assay. (C) H9c2 cells were pretreated with the indicated Tan IIA concentrations for 4 h followed by DOX (1 µM, 24 h) treatment, and cell viability was determined by MTT assay. (D) The cell morphological changes were detected via light microscopy (magnification, ×200). (E) Intracellular ROS levels were measured with a fluorometric assay. (F) The content of intracellular GSH was measured with a GSH assay kit. Data are presented as mean ± standard error of the mean (n=3). *P<0.05, **P<0.01 and ***P<0.001 vs. the control; #P<0.05 and ##P<0.01 vs. DOX. Tan IIA, tanshinone IIA; DOX, doxorubicin; ROS, reactive oxygen species; GSH, glutathione; tBHQ, tertbutyl hydroquinone.

