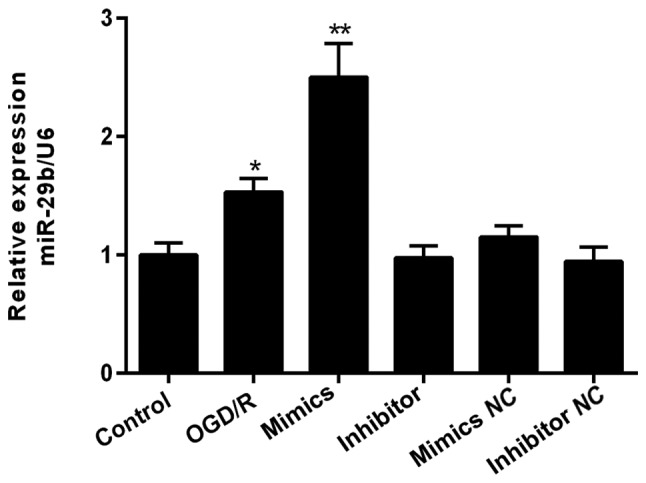
Figure 2.

Effect of exogenous miR-29b mimics and inhibitor in N2a cells under an OGD/R environment. miR-29b levels were assessed after transfection for 48 h. *Indicates P<0.05, **indicates P<0.01 vs. data from the OGD/R only group at same time point. All experiments were independently repeated three times. OGD/R, oxygen-glucose deprivation/reoxygenation
