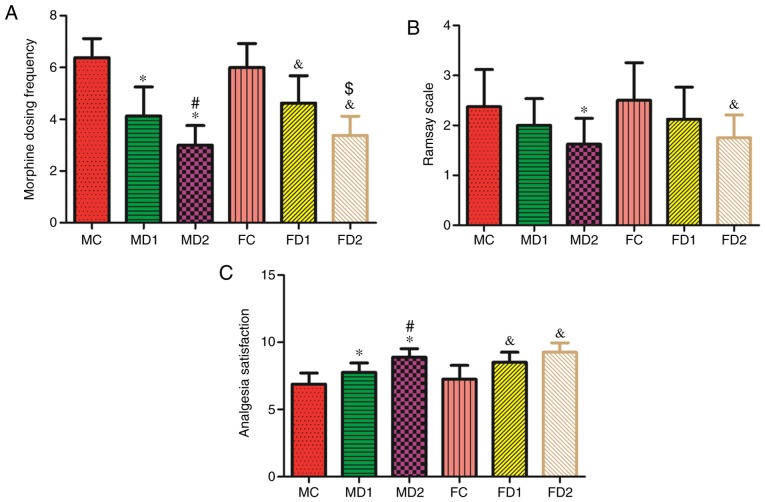
Figure 5.
Postoperative associated parameters. (A) Bar chart of post-operative morphine dosing frequency. (B) Post-operative sedation level of the patients were assessed by Ramsay scale. (C) Patients' analgesia satisfaction score after operation. Values are expressed as mean ± standard deviation.*P<0.05 vs. Group MC, #P<0.05 vs. Group MD1, &P<0.05 vs. Group FC and $P<0.05 vs. Group FD1. MC, male controlled group; FC, female controlled group.

