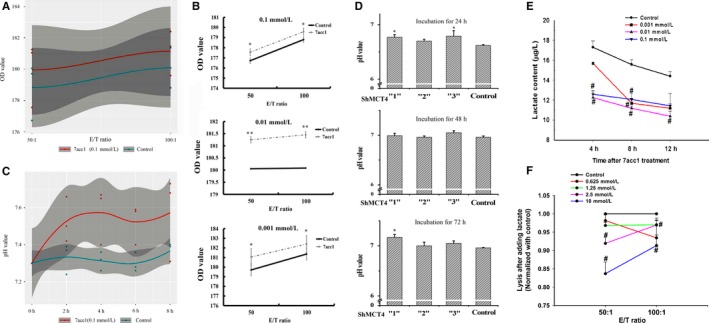
Figure 4.

Inhibition of MCT4 enhanced the cytotoxicity of the NK cells via raising pH values and decreasing the lactic acid flux content of coculture cell supernatants. A, OD value was measured using the calcein AM release assay and calculated by Wilcoxon's test for the control and 7acc1 (0.1 mmol/L)‐treated groups. B, OD value was calculated at the different concentrations of 7acc1 (0.1, 0.01, or 0.001 mmol/L) treatment. The 7acc1 treatment groups (the dotted lines) enhanced 4T1 lysed by purified primary NK cells. A calcein AM cytotoxicity assay was performed using purified NK cells as the effector, effector: target ratio = 50:1 and 100:1. C, The pH values were measured using pH meters every 2 h and analyzed by Wilcoxon's test for the control and 7acc1 (0.1 mmol/L)‐treated groups. D, The pH values were described at different incubation time points (24, 36, and 72 h) and different interference ShMCT4 vectors (weak “1,” medium “2,” and strong “3”) in 4T1‐ShMCT4 and 4T1‐Shcontrol groups. After this shift, the culture supernatant pH value increased by 0.1 to 0.4 pH units; these results were consistent and repeatable among biological replicates. *P < 0.05. E, Medium (0.7 ml) was obtained 24 h from the indicated cell after incubation with control or 7acc1. The concentration of lactate in the supernatant of 4T1 cells was determined using an ELISA kit. F, Freshly isolated primary NK cells were plated at the indicated ratios with calcein AM‐labeled 4T1 cells; then, the cells were stimulated by different concentrations of lactate. The cytotoxicity of the NK cells was determined. # P < 0.05
