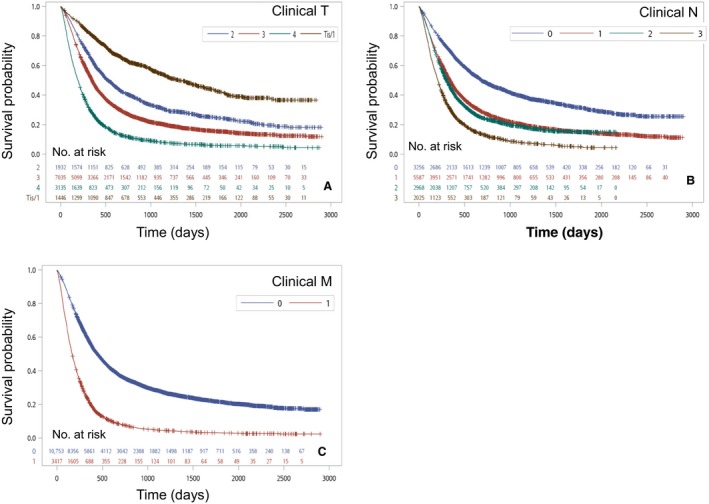
Figure 3.

(A) Kaplan–Meier survival curves for patients stratified by clinical T stage (P < 0.0001). (B) Kaplan–Meier survival curves for patients stratified by clinical N stage (P < 0.0001). (C) Kaplan–Meier survival curves for patients stratified by clinical M stage (P < 0.0001).
