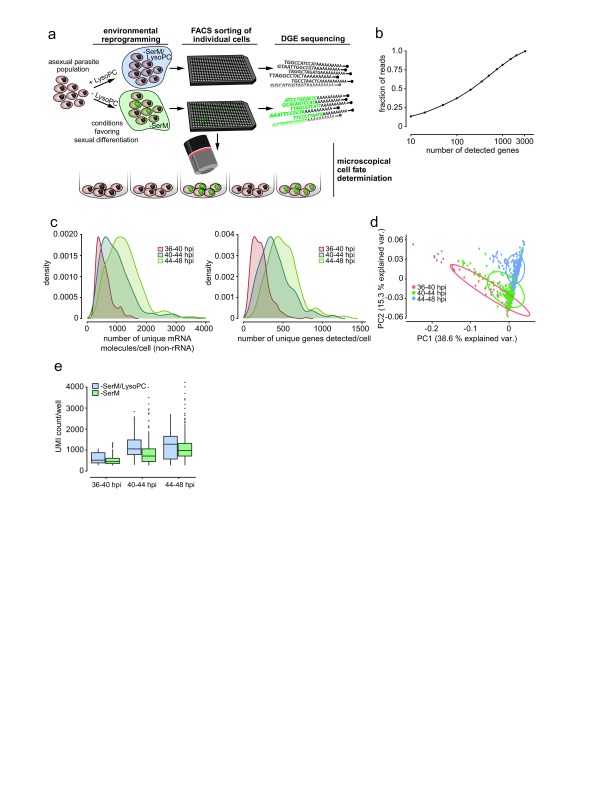
Figure 1. A digital gene expression (DGE) platform for P. falciparum single-cell mRNA profiling.
( a) Sexual commitment and experimental setup. Synchronized parasites of the Pf2004/164tdTom line are split into 2 populations, one exposed to inducing conditions using lysophosphatidylcholine (LysoPC)-deficient medium (–SerM) and one exposed to -SerM supplemented with LysoPC. Individual cells from each population are sorted by FACS for subsequent scRNAseq analysis. The remainder of cells from both populations is maintained in culture for measurement of parasite multiplication rate and sexual conversion. Sexually committed cells are denoted in green. ( b) DGE read counts per gene, sorted by highest to lowest expression in DGE. Approximately 200 genes account for 50% of all DGE reads. ( c) Distribution of DGE transcript counts (left panel) and genes detected (right panel) per cell, colored by time point. Density units are arbitrary but reflect the number of cells at a given value in the distribution. As read counts differed among and between time points, they were normalized per time point per cell prior to further analysis. ( d) Principal component analysis shows that single cell transcriptomes cluster according to time point. ( e) Unique mRNA transcripts per cell across time points are significantly lower in those incubated in SerM compared to those in –SerM supplemented with LysoPC.

