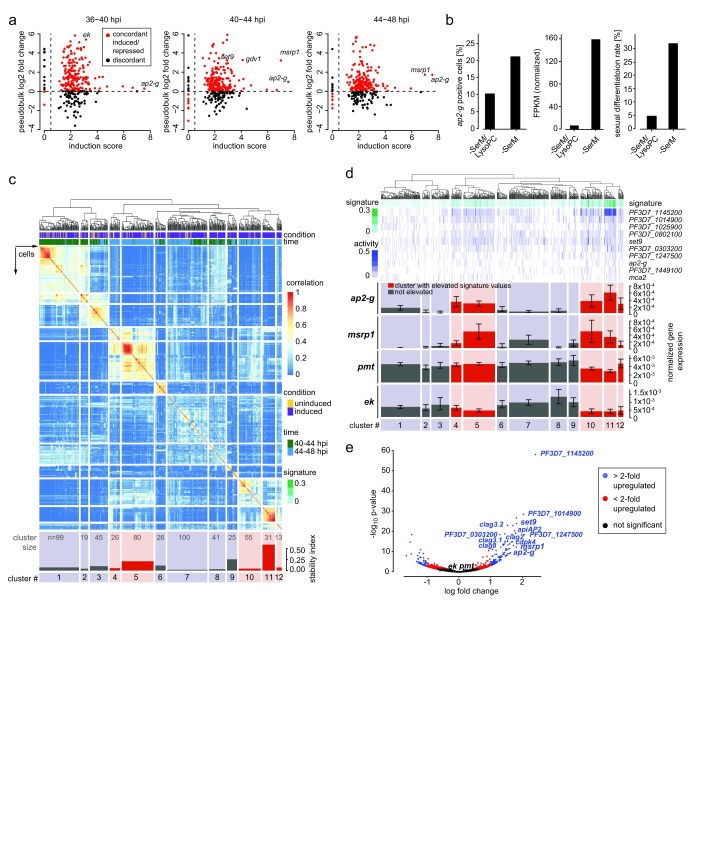
Figure 2. The transcriptional signature of sexually committed cells.
( a) Concordance of differential expression between pooled digital gene expression (DGE) reads (pseudobulk, shown as log 2 fold change) and population-level RNA-seq (defined as log 2 sum of the ratios of fragments per kilobase of transcript per million mapped reads in inducing over non-inducing conditions, or induction score 16). ( b) Comparison of ap2-g expression in single cells by DGE (left panel) and in population-level RNA-seq at 44-48 hpi (center). Sexual differentiation rates of cells used for DGE sequencing are shown in the right panel. ( c) Single-cell consensus clustering (SC3) defines a signature of sexual commitment. The subset of genes that were significantly differentially expressed from population-level RNA-seq was used to perform consensus clustering on the single cell RNA-seq gene expression. On top, a dendrogram showing k-means clustering results of single cells from 40-44 and 44-48 hpi. Just below, two parameters are shown: i) condition - induced cells are demarcated in purple and uninduced cells are demarcated in yellow; ii) time - cells from 40-44 hpi are in green and those from 44-48 hpi in blue. The rows and columns of the heat map are single cells that have been grouped into 12 clusters on the basis of their expression profiles (coloration indicating strength of clustering). The stability index (bottom) indicates how often those cells clustered together using different k values. Time point and condition from which the cells were derived are indicated, as well as positive expression of several genes of interest. Because pmt was highly expressed in most cells, only those with 80 th percentile or higher expression are marked. Cluster 11 revealed cells with high ap2-g expression and cluster stability. Cluster size is indicated. ( d) Transcriptional signature of commitment is enriched in five cellular clusters. Marker genes for SC3 cluster 11 were used to define a transcriptional signature of sexual commitment (see methods). This signature is a metric built on averaging normalized marker gene expression associated with cluster 11 (higher signature values are indicated with darker shades of green. The signature is shown in green above the heat map containing each gene’s individual expression values. Below, mean expression values and the standard error for ap2-g, msrp1, pmt, and ek are shown for each cluster. Clusters highlighted in red had significantly elevated signature values. Expression of ap2-g and msrp1 is significantly enriched in the clusters highlighted in red, while expression of pmt and ek are not. ( e) Sexually committed cells show increased expression of 125 genes. Single cells from 40-48 hpi separate into subsets with high and low marker signature (above and below the 80 th percentile, respectively), with 125 differentially expressed genes measured by scRNA-seq, including ap2-g, msrp1 and set9. Plotted p values reflect Benjamini-Hochberg correction.

