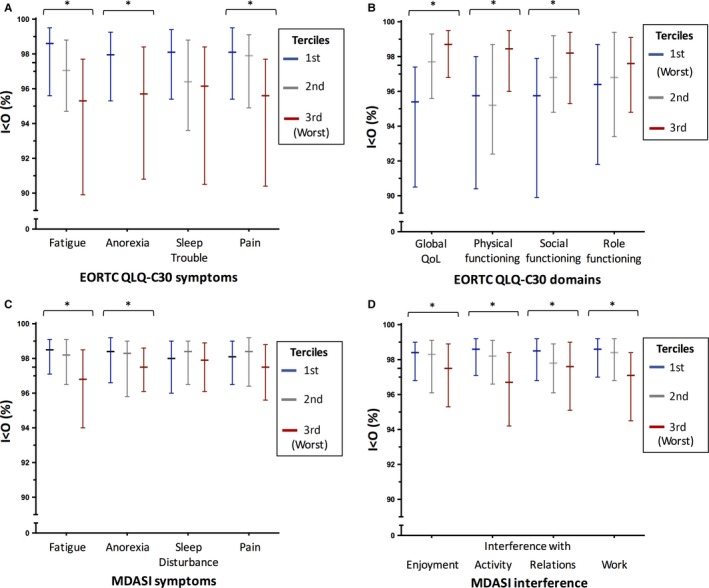
Figure 1.

Median (and interquartile range) I < O values in the subgroups defined by the terciles of the PROMs items from the EORTC (panels A and B) and MDASI (panels C and D) questionnaires: blue, first; gray, second; red, third. In all cases, the higher the tercile, the more severe the symptom, except for the EORTC QLQ‐C30 domains (panel B), in which the higher the tercile, the better the quality of life and the functioning. In all cases, stars indicate P < 0.0001. Other nonsignificant P values are detailed in the Section 3
