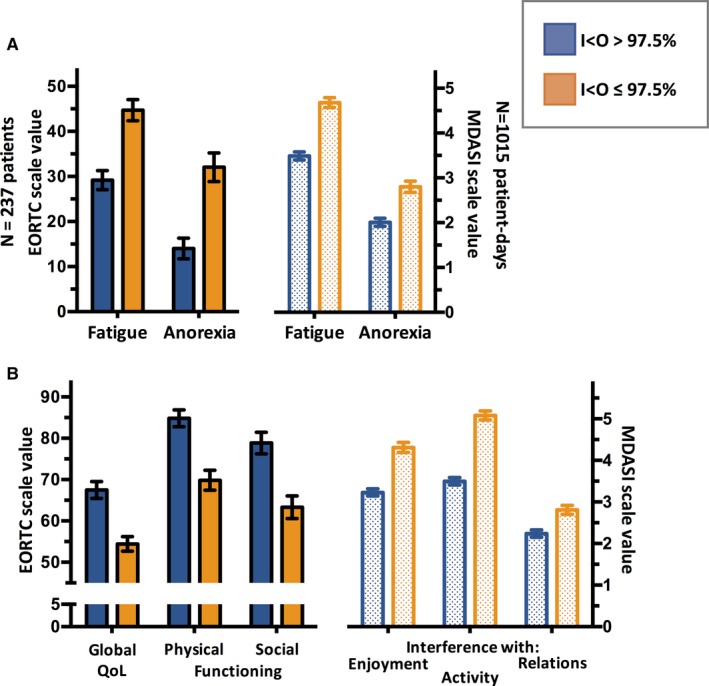
Figure 2.

Mean (±SEM) values PROMs indices according to high (blue) or low (orange) I < O, indicating robust and disrupted circadian rest‐activity rhythm, respectively. For symptoms (panel A), in both scales, higher values imply worse symptom severity (range for EORTC: 0‐100; for MDASI: 0‐10). In panel B, for the EORTC scale, higher values designate better quality of life domains (range: 0‐100), while for MDASI, lower values imply less intense interference (range: 0‐10). For all comparisons, P < 0.001
