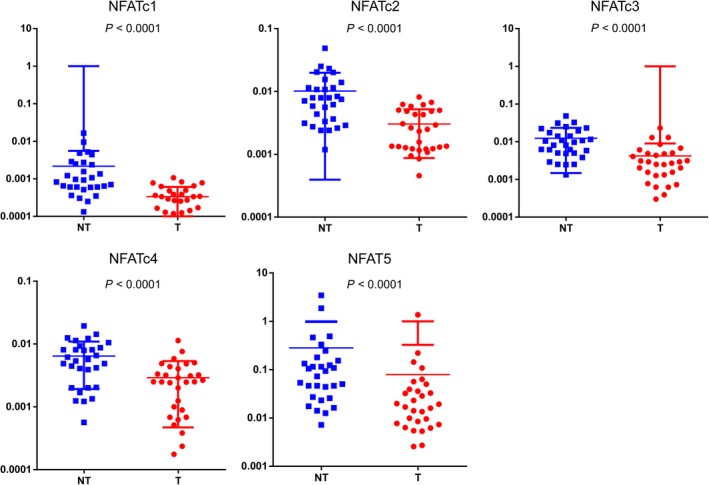
Figure 1.

NFAT family member mRNA levels are downregulated in HCC. Expression of NFAT family members NFATc1, NFATc2, NFATc3, NFATc4, and NFAT5 mRNA in 30 pairs of HCC and corresponding adjacent nontumor liver tissues were evaluated by real‐time quantitative PCR (qPCR). NFAT family member expression was significantly downregulated in tumor tissues compared to nontumor tissues. Data are presented as NFAT expression normalized to β‐actin. T: HCC tumor tissue. NT: adjacent nontumor liver tissues. Statistical analysis was performed using Wilcoxon matched‐pairs signed‐rank test. Data are presented as the mean ± SD. Dots represent mRNA level from 30 tissues
