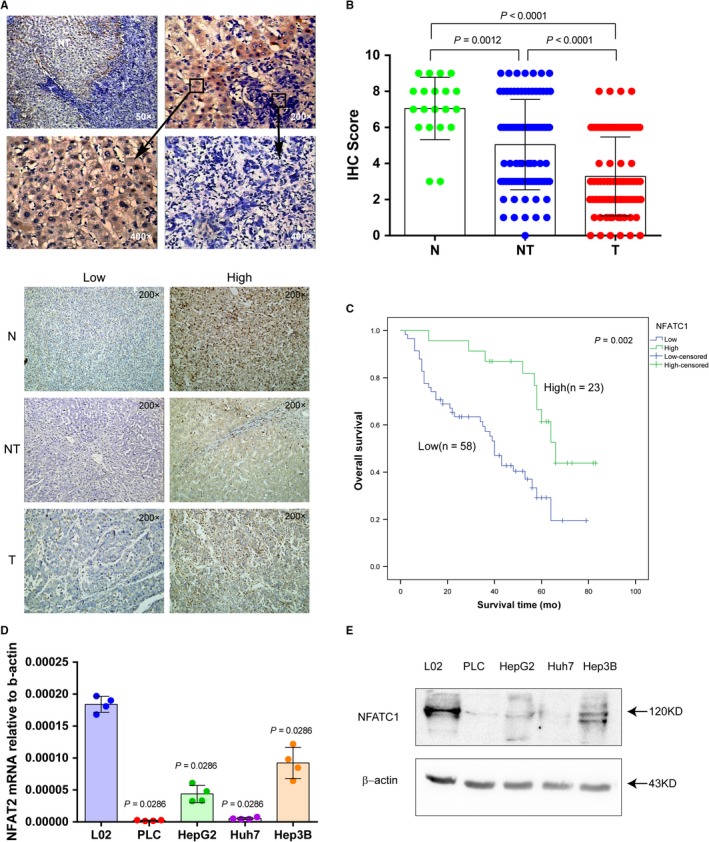
Figure 2.

NFATc1 expression in HCC tissues and cell lines and its effect on patients with HCC prognosis. A, Representative images of NFATc1 protein expression in HCC tissues, adjacent nontumor tissues and normal liver tissues determined by immunohistochemistry (IHC). T: HCC tumor tissue. NT: adjacent nontumor liver tissues. N: normal liver tissues. B, IHC scores in HCC, adjacent nontumor liver tissues and normal liver tissues. For NT vs T, statistical analyses were performed using Wilcoxon matched‐pairs signed‐rank test. For N vs NT or T, statistical analysis was performed using the Mann‐Whitney U test. Dots represent IHC score from 20 normal tissues and 80 pairs of HCC and adjacent nontumor tissues. C, The prognostic value of NFATc1 expression on patient survival was calculated by the Kaplan‐Meier method and log‐rank tests. D, Relative NFATc1 mRNA expression in one normal cell line (L02) and four HCC cell lines (PLC, HepG2, Huh7, and Hep3B). Statistical analysis for L02 vs PLC, HepG2, Huh7, and Hep3B was performed by the Mann‐Whitney U test. β‐actin was used as an internal control. Data are presented as the mean ± SD. Dots represent data from four replicates of pipetting for measurement of qPCR. E, NFATc1 protein expression in one normal cell line (L02) and four HCC cell lines (PLC, HepG2, Huh7, and Hep3B)
