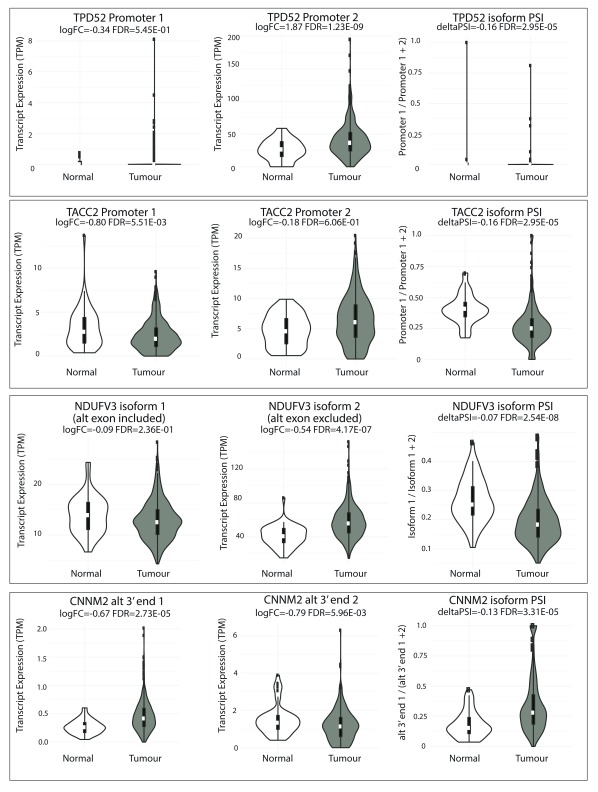
Figure 3. Differential expression of androgen dependent mRNA isoforms in prostate cancer versus normal tissue within the PRAD TCGA cohort for TPD52, TACC2, NDUFV3 and CNNM2.
Violin-boxplots of expression in transcripts per million mapped reads (TPM) of Isoforms 1 (left panel) and 2 (central panel), and of their expression ratio in PSI (right panel) in normal and tumour samples. The mean log2 fold-change (logFC) in expression between tumour and normal samples and the associated FDR-adjusted p-value for the moderated t-statistic of differential expression are shown for both isoforms (left and central panels). The mean difference in PSI (deltaPSI) between tumour and normal samples and the associated FDR-adjusted p-value for the Mann-Whitney U test of differential splicing are shown (right panel).

