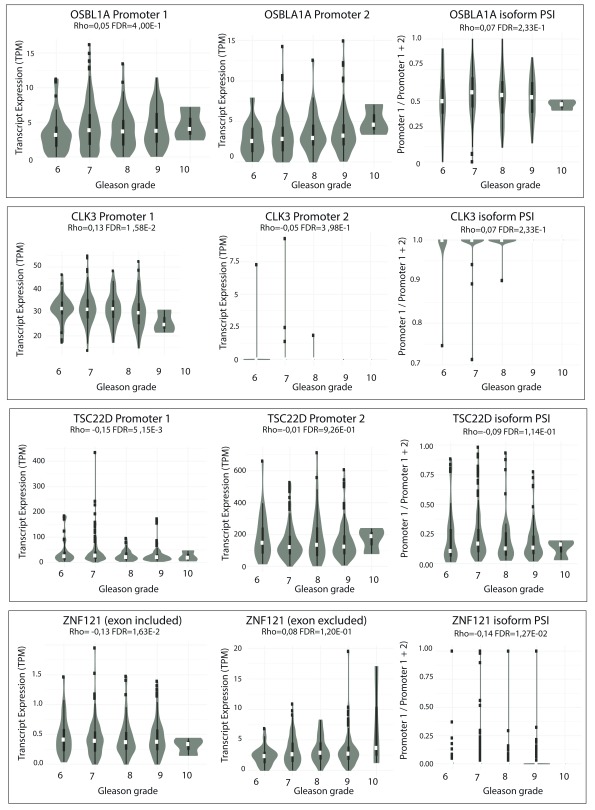
Figure 4. Differential alternative mRNA isoform expression in the TGCA PRAD cohort across different Gleason grades for OSBPL1A, CLK3, TSC22D and ZNF121.
Violin-boxplots of expression in transcripts per million mapped reads (TPM) of Isoforms 1 (left panel) and 2 (central panel), and of their expression ratio (right panel) by Gleason grade. Their respective Spearman’s correlation coefficient (Rho) with grade and associated FDR-adjusted p-value are shown.

