
Figure 2.
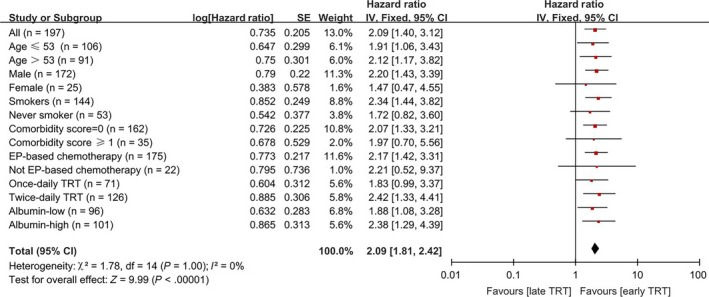
Forest plot depicting PFS based on subgroup analysis between Early and Late TRT regimens. Data are derived from Cox's analysis without covariates
Official websites use .gov
A
.gov website belongs to an official
government organization in the United States.
Secure .gov websites use HTTPS
A lock (
) or https:// means you've safely
connected to the .gov website. Share sensitive
information only on official, secure websites.
Forest plot depicting PFS based on subgroup analysis between Early and Late TRT regimens. Data are derived from Cox's analysis without covariates