
Figure 1.
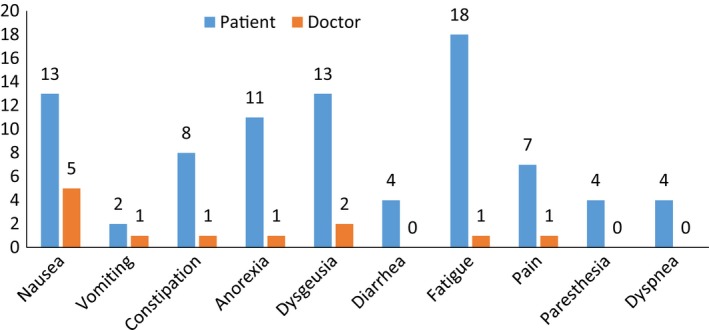
Percentage of cycle days with each adverse event as reported by patients and doctors. Decimals are rounded to the nearest unit. Source data are summarized in Table S5. All differences are statistically significant by Student's t test for paired data