Figure 1.
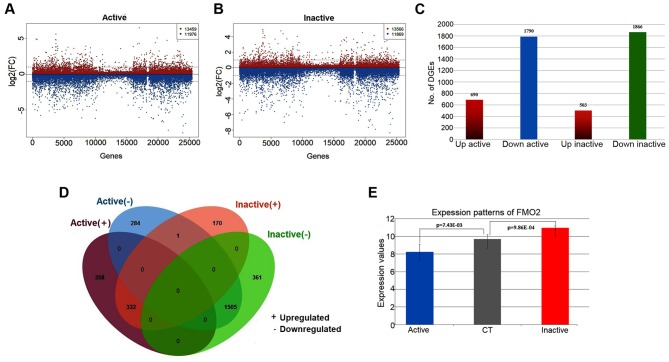
Overview of DEGs associated with PDR. (A) Scatter diagram illustrating log2(FC) values of each gene between the active and control samples, including 13,459 upregulated genes and 11,976 downregulated genes. (B) Scatter diagram illustrating log2(FC) values of each gene between the inactive and control samples, including 13,566 upregulated genes and 11,869 downregulated genes. (C) Histogram of the numbers of DEGs in the active and inactive samples. There were 690 upregulated genes and 1,790 downregulated genes identified as significant in the active samples. There were 503 upregulated genes and 1,866 downregulated genes significantly identified in the inactive samples. (D) Venn diagram illustrating the overlapping genes of DEGs in the active and inactive samples. (E) Bar chart of the expression patterns of FMO2 in the active and inactive samples. FMO2 was significantly downregulated (logFC=−1.44, P=0.00743) in the active FVMs but significantly upregulated (logFC=1.28, P=0.000986) in the inactive FVMs. PDR, proliferative diabetic retinopathy; FC, fold change; FVMs, fibrovascular membranes; FMO2, flavin-containing monooxygenase isoform 2; CT, control.

