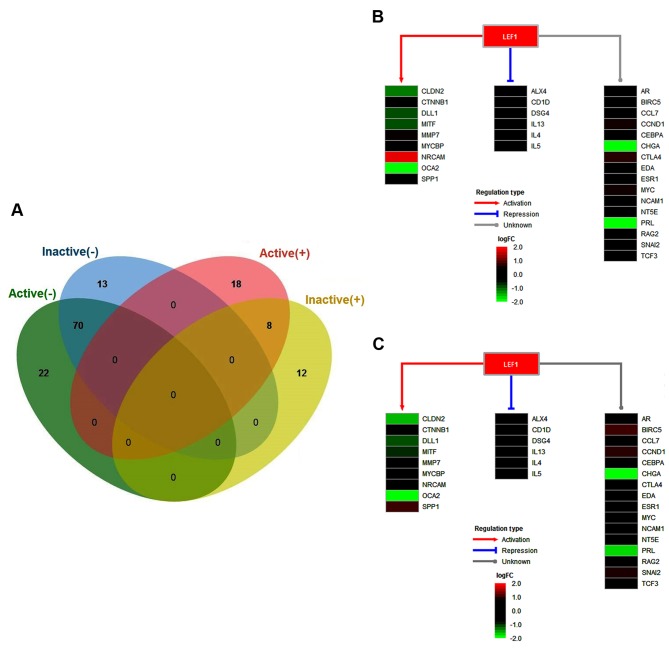
Figure 3.
Transcription factors associated with proliferative diabetic retinopathy. (A) Venn diagram illustrating the overlapping key TFs in the active and inactive samples. (B) Regulatory model of LEF1 in the active samples, including the regulation types of activation, repression, and unknown. (C) Regulatory model of LEF1 in the inactive samples, including the regulation types of activation, repression, and unknown. TFs, transcription factors; LEF1, lymphoid enhancing binding factor-1.

