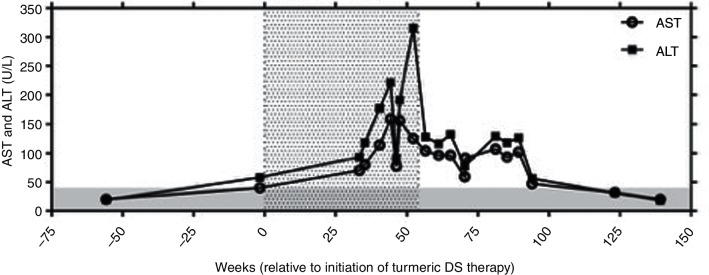
Figure 1.
Aspartate aminotransferase (AST) and alanine transaminase (ALT) levels (U/L) plotted by week relative to initiation of turmeric therapy. The grey-shaded area represents an average upper limit of normal for ALT and AST values, which were assayed by various clinical laboratories. The stippled area represents the time period of turmeric use. DS, dietary supplements.

