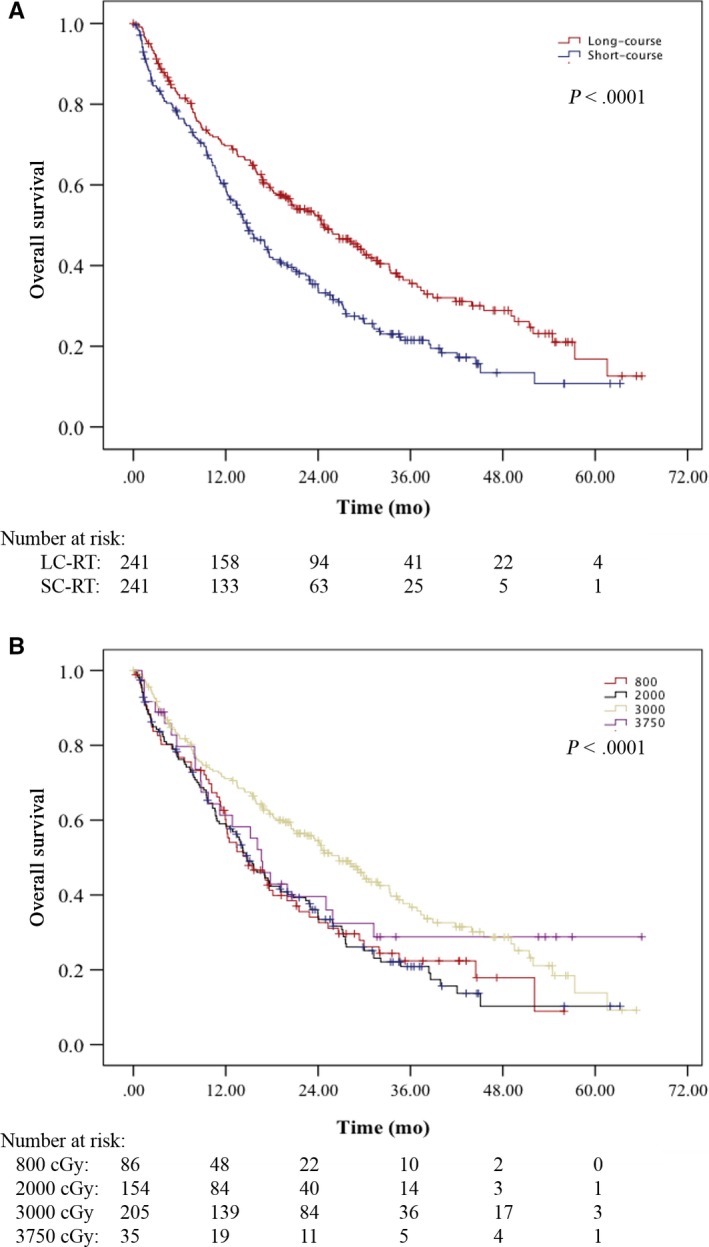
Figure 3.

Propensity‐matched cohort. A, Kaplan‐Meier overall survival curve of patients treated with long‐course radiation therapy (LG‐RT) vs short‐course radiation therapy (SC‐RT). P < .0001. B, Kaplan‐Meier overall survival curve of patients treated with 8 Gy in 1 fraction (800 cGy), 20 Gy in 5 fractions (2000 cGy), 30 Gy in 10 fractions (3000 cGy), and 37.5 Gy in 15 fractions (3750 cGy). 8 Gy vs 20 Gy, P = .776; 8 Gy vs 37.5 Gy, P = .409; 20 Gy vs 37.5 Gy, P = .278; 30 Gy vs 8 Gy and 20 Gy, P < .0001; 30 Gy vs 37.5 Gy, P = .513
