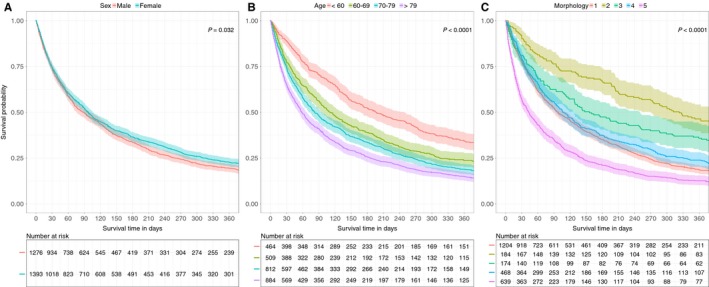
Figure 4.

Kaplan–Meier survival curves for death in CUP patients depending on sex, age and morphology A, overall, B, by age group, C, by morphology with 1: adenocarcinomas, 2: squamous cell carcinomas, 3: neuroendocrine carcinomas, 4: unspecified/undifferentiated carcinomas, 5: unclassified neoplasms/tumors
