
Figure 2.
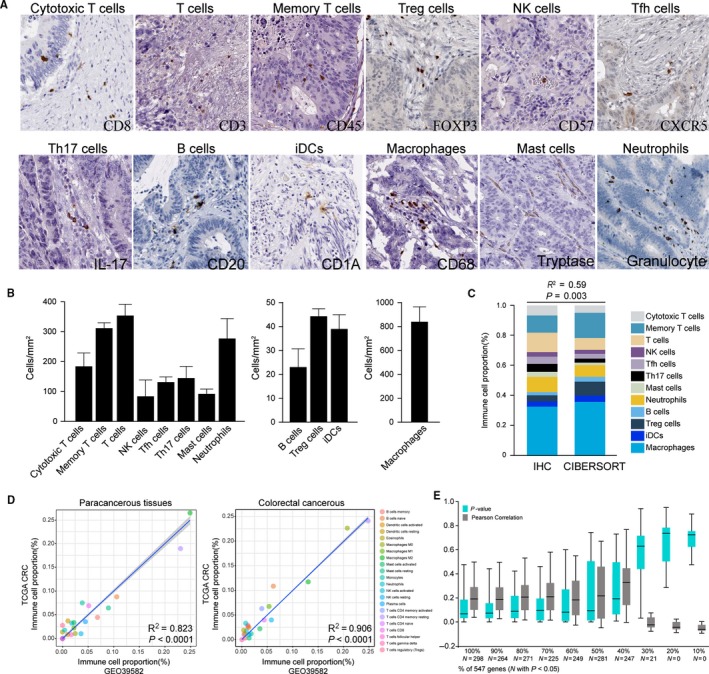
The performance of CIBERSORT for characterizing TIICs composition in CRC. A, Representative immunohistochemical images of infiltrated immune cells in CRC. T cells (quantified with marker CD3), cytotoxic T cells (CD8), memory T cells (CD45), Treg cells (FOXP3), activated T or NK cells (CD57), Tfh cells (CXCR5), Th17 cells (IL‐17), B cells (CD20), iDCs (CD1a), macrophages (CD68), mast cells (Tryptase), neutrophils (granulocyte) were stained and quantified by immunohistochemistry. B, The cell density of immune cell subpopulations. The density of the cells was recorded as the number of positive cells per mm2 surface area by use of a dedicated image‐analysis workstation (Spot Browser, Alphelys). To approximate ground truth proportions in CRC biopsies, levels were inferred by averaging TIICs counts from the tumor center and invasive margin of 30 patients. C, Relative TIICs proportions evaluated in CRC by CIBERSORT vs immunohistochemical analysis (IHC) on independent samples. CIBERSORT results are represented as mean TIICs proportions obtained from TCGA CRC cohort. D, Relative proportions of 22 TIICs subpopulation, as inferred by CIBERSORT, are compared between two independent datasets (TCGA CRC and GSE39582). E, Box plot of the distribution of CIBERSORT P‐value and average Pearson's correlation using datasets with progressively fewer (10% increments) barcode genes for 644 cases from the TCGA cohort