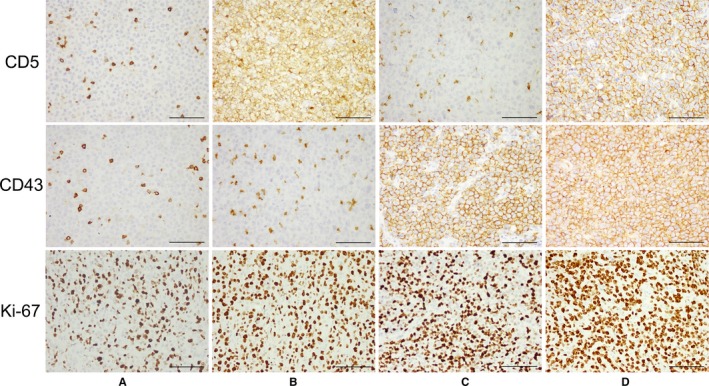
Figure 1.

Representative Immunohistochemically Stained Sections of DLBCL Tissues with Different CD5/CD43 Expression Patterns Including CD5−/CD43− (A), CD5+/CD43− (B), CD5−/CD43+ (C), and CD5+/CD43+ (D). The CD5+/CD43+ group showed a relatively higher Ki‐67 index than the other groups. Scale bar = 100 μm (original magnification, ×400)
