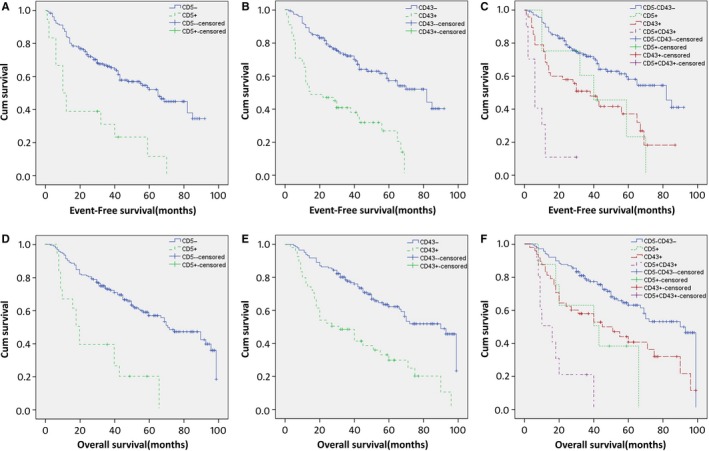
Figure 2.

Kaplan‐Meier Survival Curves for CD5 Expression (A, D), CD43 Expression (B, E), and four Groups of CD5 and CD43 Expression (C, F) in DLBCL. Survival was significantly better for patients negative for CD5 (P < 0.001 for both EFS and OS) and for CD43 (P < 0.001 for both EFS and OS) than that for patients with positive expression level. Patients with the CD5+/CD43+ coexpression profile had the worst outcome for OS among the 4 groups. Pairwise comparisons showed that a statistically significant difference in survival rates existed between the CD5+/CD43+ group and any of the other three groups (P < 0.05 for both EFS and OS)
