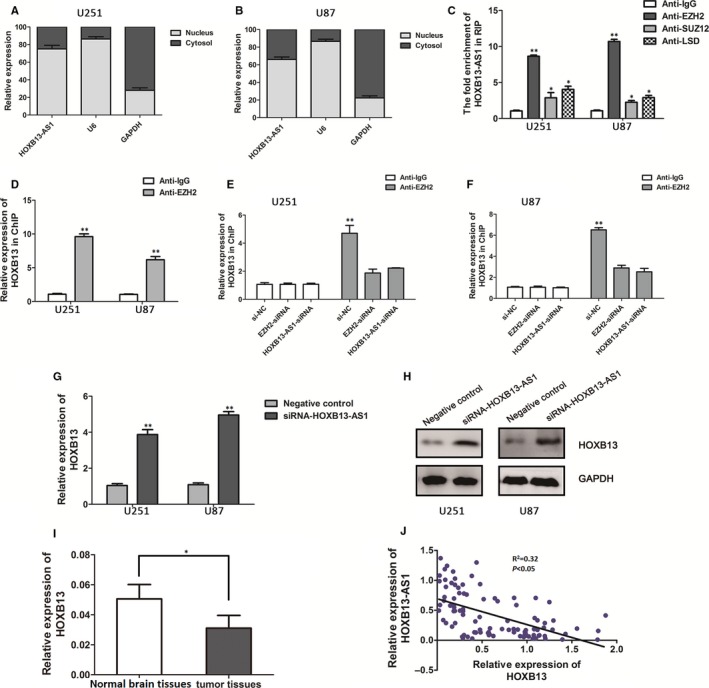
Figure 3.

HOXB13‐AS1 epigenetically regulate HOXB13 gene transcription by through interacting with EZH2. A, B, Distribution of HOXB13‐AS1 in U251 and U87 cells was determined by qRT‐PCR. HOXB13‐AS1 was mainly localized in nucleus of U251 and U87 cells (mean ± SD). C, RIP assay was performed to determine the association between HOXB13‐AS1 and catalytic components (EZH2, SUZ12, and LSD1) of PRC2. The fold enrichment of HOXB13‐AS1 in U251 and U87 cells with antibodies against EZH2, SUZ12, and LSD1 is relative to nonspecific IgG control. Error bars represent the mean ± SD of three independent experiments, Student's t test, *P < 0.05. D, ChIP‐PCR assays were performed to determine the interaction between the promoter region of HOXB13 and EZH2 with antibodies against EZH2 and IgG (mean ± SD), Student's t test, *P < 0.05. E, F, ChIP‐PCR assays of EZH2 enrichment of the promoter region of HOXB13 after the silence of EZH2 or HOXB13‐AS1 in U251 and U87 cells with antibodies against EZH2. HOXB13‐AS1 affects the mRNA levels and protein levels of HOXB13 in U251 and U87 cells after transfection of the siRNA of HOXB13‐AS1 as detected by qRT‐PCR assay (G) and Western blot assay (H). Data are indicated as mean ± SD for three independent experiments. Student's t test, *P < 0.05, **P < 0.01. I, qRT‐PCR analysis of relative expression of HOXB13 in glioma tissues compared with normal brain tissues. HOXB13 expression levels were normalized to GAPDH. The P value was calculated using paired t test, *P < 0.05. J, The association between the HOXB13‐AS1 and HOXB13 mRNA expression levels was determined by the Pearson's correlation analysis (R 2 = 0.32, P < 0.05)
